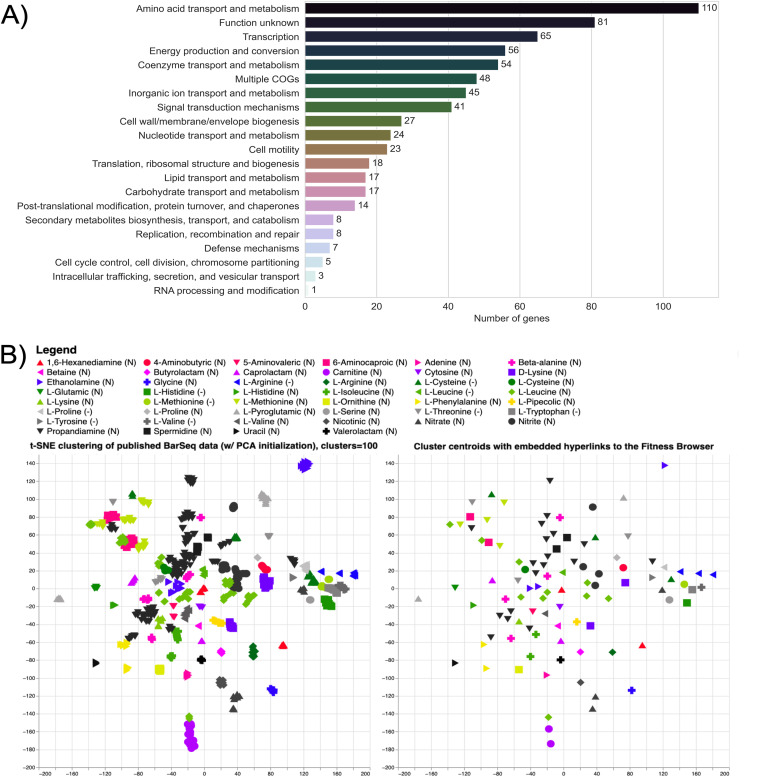
FIG 1.
Global analysis of the P. putida KT2440 BarSeq data. (A) Significant genes (|fitness| > 1 and |t | > 5) from all 71 tested conditions sorted by their cluster of orthologous groups (COGs) based on the eggNOG database (149, 153, 154). “Multiple COGs” indicates that there was more than one COG assigned. (B) Image of the interactive t-SNE visualization (Fig. I1 available at https://ppnitrogentsne.lbl.gov) showing the legend, t-SNE clustering (left) and cluster centroids (right). By clicking on a substrate in the legend, the corresponding cluster (left) and centroid (right) is highlighted, opening a list of cluster members and additional information. By clicking the highlighted centroid (right), the user is redirected to the Fitness Browser (https://fit.genomics.lbl.gov) (20), where the fitness data for all significant genes in the condition cluster is shown. An additional t-SNE visualization including COG identifiers is presented in Fig. I3 (available at https://ppnitrogentsne.lbl.gov). More information about the interactive figures can be found in the description of Fig. S3.

