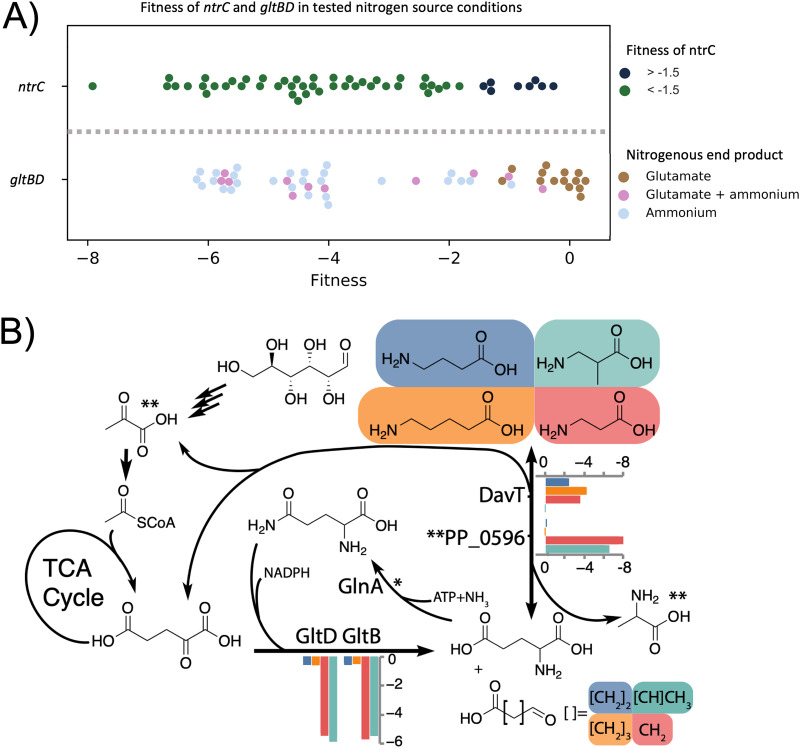
FIG 2.
(A) Scatterplot of the average fitness values (n = 2) for ntrC and gltBD in all the tested nitrogen conditions. For ntrC, nitrogen conditions are grouped based on whether the fitness phenotype of ntrC is < −1.5 (blue) or > −1.5 (green). Conditions where ntrC fitness is >−1.5 (green) may be less dependent on ntrC activation and are shown in Table 2. gltBD phenotypes are sorted based on putative glutamate (brown), glutamate+ammonium (pink), or ammonium (gray) release during nitrogen source utilization. Fitness values for conditions resulting in gltBD fitness >−1.5 are shown in Table 3. (B) The role of the GS/GOGAT cycle in the beta-alanine (red), 3-aminoisobutyrate (green), 4-aminobutyrate (blue), and 5-aminovalerate (orange) nitrogen source conditions. Average fitness values (n = 2) are shown for gltBD, davT, and the pyruvate dependent transaminase PP_0596. *GlnA lacks fitness data because the library has no insertions. **Pyruvate and alanine are the specific nitrogen acceptor and product of PP_0596.

