Fig. 1.
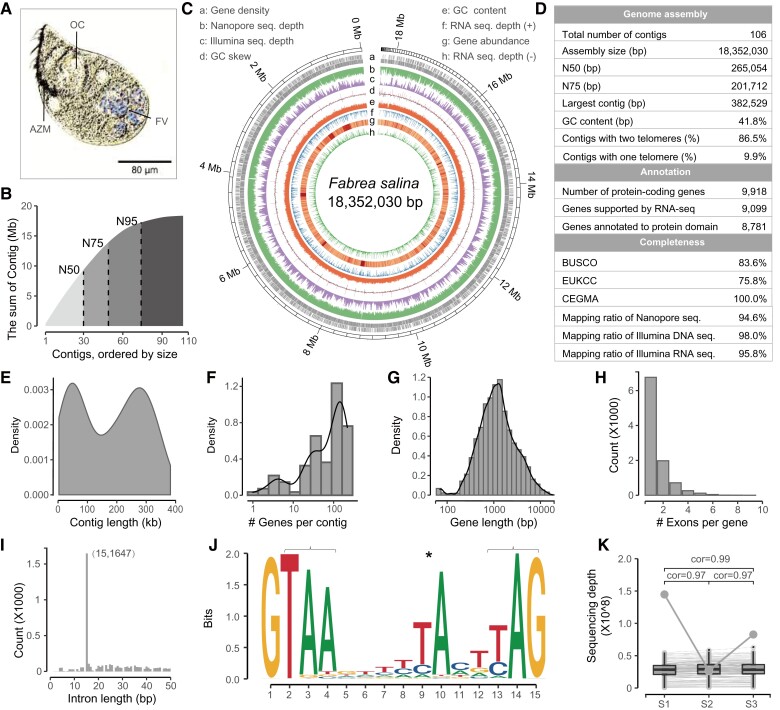
Sequencing and assembly of the macronuclear genome of Fabrea salina. (A) Morphology of F. salina in optical microscope. (B) The cumulative distribution of contig length. The N50, N75, and N95 was 265.05, 201.71, and 62.71 kb, respectively. (C) Characteristics of the 106 assembled contigs of F. salina. Tracks a–h represent the distribution of gene density, genome coverage of nanopore reads, genome coverage of Illumina reads, GC skew, GC density, genome coverage of RNA-seq reads in the forward strand (+), gene expression abundance, and genome coverage of RNA-seq reads in the reverse strand (−), respectively, with values calculated in 2 kb sliding windows. (D–I) Statistics on assembly and annotation of the F. salina MAC genome, which shows the distribution of contig length, gene number in each contig, gene length, exon number and intron length. (J) Weblogo plot of 15 bp intron. Asterisk denotes an atypical internal TA dinucleotide, and brackets denote two potential stop codons. (K) Consistency of contig copy number among samples. The bottom value shows the Spearman correlation coefficients between samples. The same contig is connected by a line. The grey dot represents the most variable contig, which is the mitochondrial genome. FV, food vacuoles; OC, oral cavity; AZM, adoral zone of membranelles.

