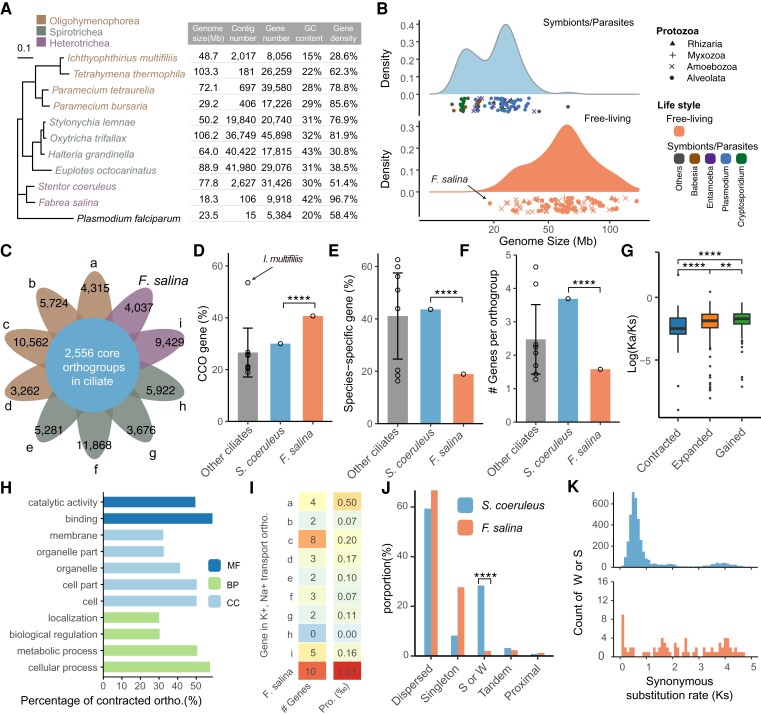
Fig. 2.
Comparative genomic analysis among Fabrea salina and its relatives. (A) Phylogenetic tree of 10 representative ciliates based on the 18S rRNA gene, with Plasmodium falciparum serving as an outgroup. The right panel shows their corresponding genomic features. (B) Comparison of genome size among Protozoa. The top and bottom panels show the genome size distribution of the studied symbionts/parasites and free-living species, respectively. The dot shapes represent different taxonomic classifications, namely rhizaria, myxozoa, amoebozoa, and alveolata. The dot colors represent four main groups of symbiotic or parasitic microorganisms. (C) The Venn diagram represents the number of ciliate core orthogroups present in >7 ciliates. The value in petals denotes the gene number in CCO for each species. The order from a to i represents (a) Ichthyophthirius multifiliis, (b) Tetrahymena thermophila, (c) Paramecium tetraurelia, (d) Paramecium bursaria, (e) Stylonychia lemnae, (f) Oxytricha trifallax, (g) Halteria grandinella, (h) Euplotes octocarinatus, and (i) Stentor coeruleus. (D) The proportion of the CCO gene in each ciliate. The proportions of S. coeruleus and F. salina were 30.00% and 40.70%, respectively. The mean proportion of other ciliates was 26.59% (95% CI: 17.16–36.02%). Each dot in the bar denotes one species. The height of the bar represents the mean value of the remaining eight species, and the error bar represents the 95% confidence interval of the mean. ****P < 0.0001, based on χ2 test. (E) The proportion of species-specific genes in each species. ****P < 0.0001, based on χ2 test. (F) The median gene number in orthology group for each ciliate. (G) Boxplot for the distribution of Kn/Ks. Gained gene families show a significantly higher Kn/Ks ratio than the expanded and contracted gene families. ****P < 0.0001, ***P < 0.001, **P < 0.01, based on a two-tailed Mann–Whitney test. (H) The GO classification of the contracted orthogroups. (I) Gene content of two orthogroups in 10 ciliates. (J) Distribution of gene duplication events in S. coeruleus and F. salina segmental duplicates/whole-genome duplication, S or W. (K) Ks plots for duplicate genes in S. coeruleus (top) and F. salina (bottom). MF, molecular function; BP, biological process; CC, cellular component.

