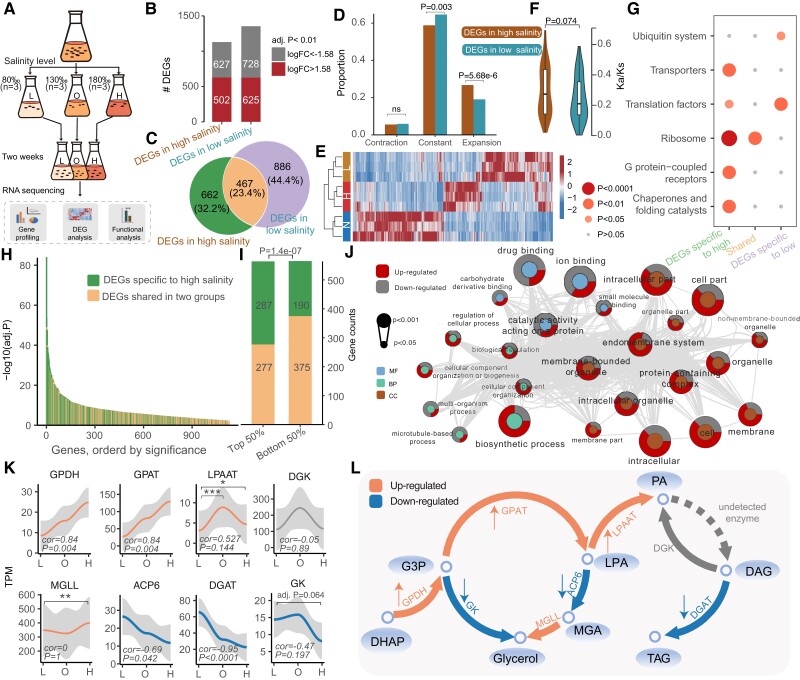
Fig. 4.
Genetic adaptation for salinity tolerance. (A) Flow chart of the experimental design and transcriptome analysis of F. salina under salinity stress. (B) The number of differentially expressed genes in the high and low salinity groups. Both groups were compared against the optimum salinity group. (C) Venn diagram of differentially expressed genes in the two groups. (D) The bar graph indicates the enrichment of DEGs in expanded and contracted gene families. (E) Heatmap for differentially expressed genes. (F) Kn/Ks of differentially expressed genes. P value was determined based on Mann–Whitney test. (G) KEGG enrichment analysis of DEGs in different categories. The color of the dots represents the P value. (H) Differential significance distribution of the DEGs in in high salinity group. (I) Gene counts of the DEGs in the high salinity group. (J) Significant GO terms (P < 0.05) in the high salinity-specific DEGs. The P value in I and J was determined based on Fisher’s exact test. (K) Distribution of gene expression at different salinities. The Spearman correlations and their significance are marked at the bottom of the image. The adjusted P values resulted from DEG analysis and are marked at the top of the image. ****Adj. P < 0.0001, ***adj. P < 0.001, **adj. P < 0.01, *adj. P < 0.05. (L) Schematic diagram of the pathways associated with glycerol and PA synthesis. Orange and blue colors represent up-regulated and down-regulated steps under hypersalinity stress, respectively. GPDH, glycerol 3-phosphate dehydrogenase; GPAT, glycerol-3-phosphate acyltransferase; LPAAT, lysophosphatidic acid acyltransferase; DGK, diacylglycerol kinase; GK, glycerol kinase; MGLL, monoglyceride lipase; ACP6, lysophosphatidic acid phosphatase type 6 precursor; DGK, diacylglycerol kinase; DGAT, diacylglycerol acyltransferase; DHAP; dihydroxyacetone-phosphate; G3P; glycerol-3-phosphate dehydrogenase; MGA, monoacylglycerol; LPA, lysophosphatidic acid; PA, phospholipid acid; DAG, diacylglycerol; TAG, triacylglycerol.

