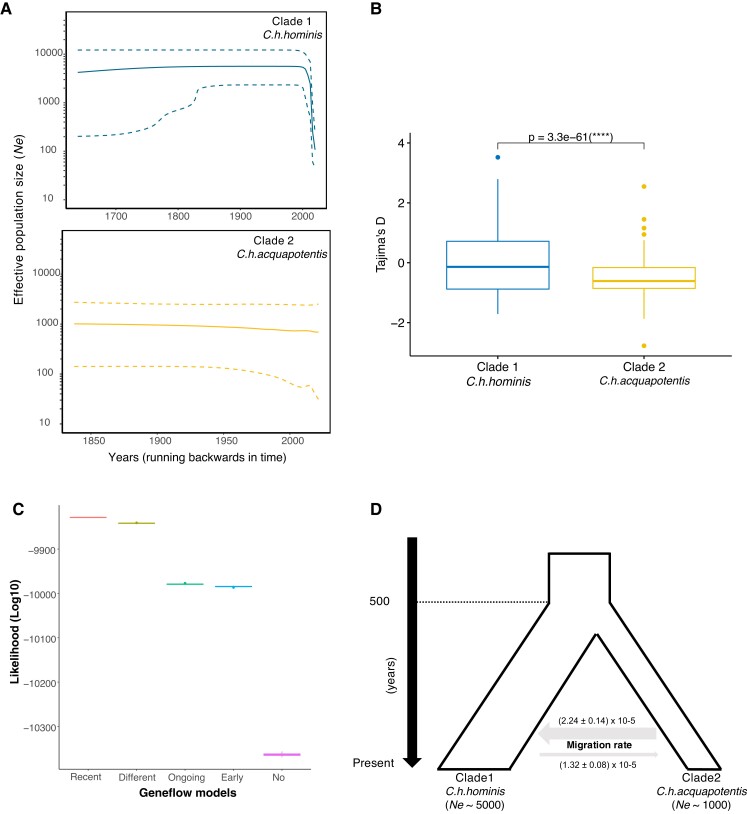
Fig. 2.
Demographic histories and population size and secondary contact between Cryptosporidium hominis hominis (clade 1) and Cryptosporidium hominis aquapotentis (clade 2). (A) BSPs depicting change in Ne (effective population size) through time, for both the clades. The central dark line and the upper and lower dashed lines on Y-axis are mean estimates and 95% HPD intervals of Ne, respectively. X-axis is time in years, running backwards. (B) Boxplot showing significant difference (two-sided t-test) in Tajima’s D values between C. h. hominis (clade 1) and C. h. aquapotentis (clade 2). (C) Higher likelihood (log10) for “recent gene flow” model. Comparing likelihood distributions of gene flow models and observed significant difference (one-way ANOVA test, F = 2629761, df = 4, P value < 2 × 10⁻¹⁶). Further, post hoc Tukey–HSD test revealed difference in likelihood between all the models (P value < 1 × 10⁻¹⁶). (D) Graphical representation of demographic history of C. hominis, illustrating recent secondary contact and migration rates between the two clades (mean ± SE).

