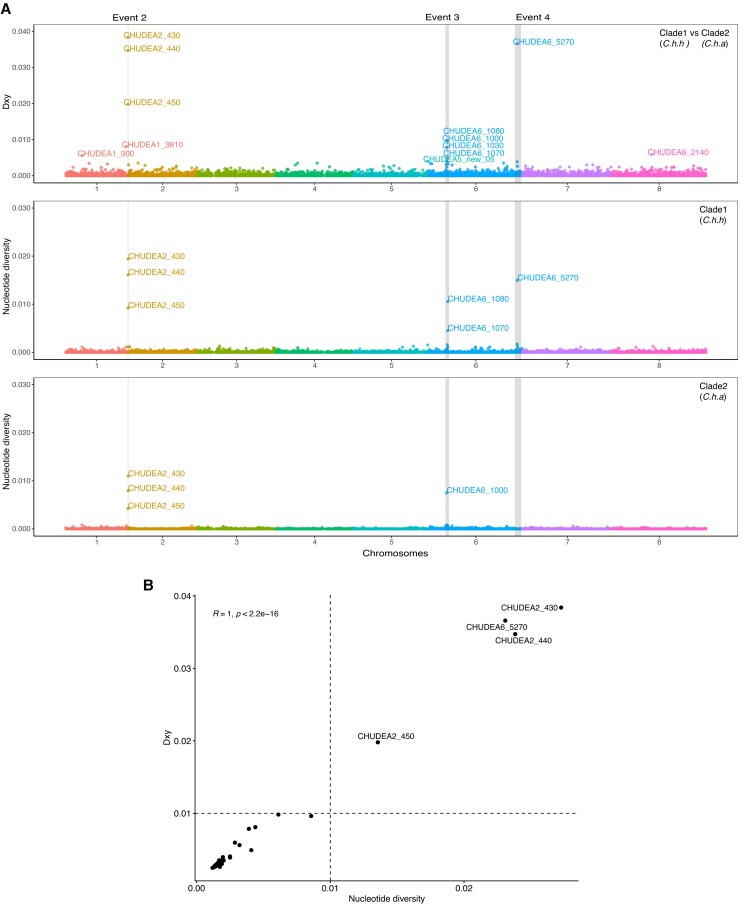
Fig. 4.
Population genetic analyses of GIPVs. (A) Population genetic and divergence analyses of introgressed regions. X-axis represents genomic positions of eight chromosomes highlighted with different colors. Population divergence (Dxy) between Cryptosporidium hominis hominis (clade 1) and Cryptosporidium hominis aquapotentis (clade 2) for each gene were plotted on Y-axis (top panel). Nucleotide diversity (π) for C. h. hominis (middle panel) and C. h. aquapotentis (bottom panel) for each gene, was also plotted on Y-axis, respectively. The breakpoints of four recombination events (event 1–4) were indicated by gray vertical boxes. Event 1 was undetected in C. h. aquapotentis. (B) Correlation between π and Dxy were plotted to identify polymorphic and potential virulence genes.

