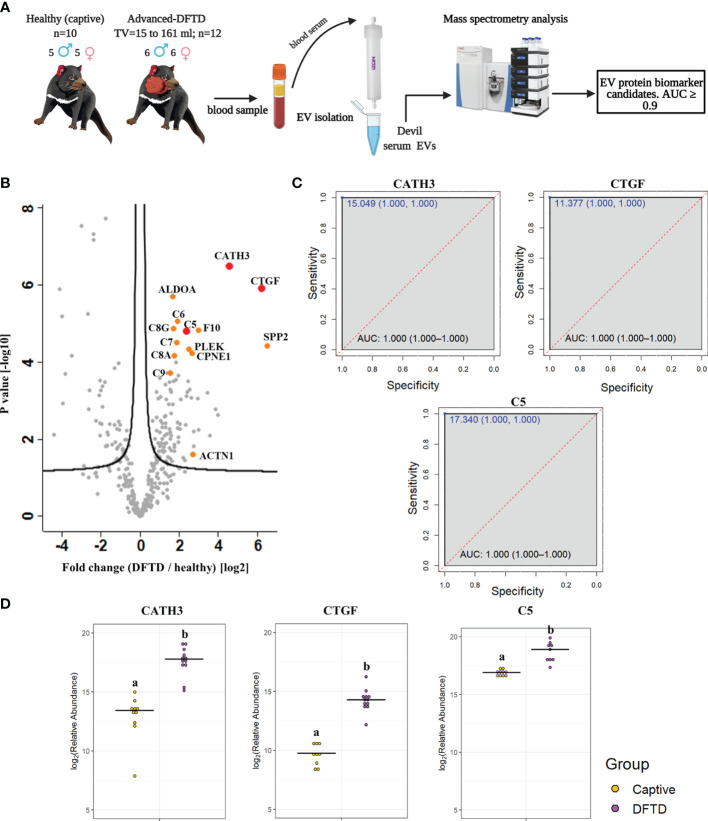
Figure 2.
Discovery cohort. (A) Extracellular vesicles (EVs) were isolated from 22 devil serum samples (12 DFTD-advanced and 10 healthy captive devils) by size exclusion chromatography columns. EVs were analyzed by mass spectrometry to explore DFTD EV biomarker candidates. TV = tumor volume. (B) Volcano plot of protein relative abundance fold changes (log2) between EVs derived from advanced stage DFTD and healthy devils vs fold change significance. Proteins denoted in red are perfect disease status classifiers (area under the receiver operating characteristic curve [AUC] = 1.0). Orange denotes proteins with an AUC > 0.95. (C) Receiver operating characteristic curve analysis for the EV sample proteins CATH3, CTGF, and C5 (DFTD relative to healthy controls). The dashed red identity line indicates random performance. The cut-off values were determined using Youden’s index and are indicated in blue at the left top corner of the ROC curve, and specificity and sensitivity are indicated in brackets, respectively. (D) Dot plots depicting the relative abundance of the proteins CATH3, CTGF and C5 obtained from healthy animals and devils with advanced stages of DFTD, different letters “a” and “b” indicate significant differences between groups (Student’s t-test, FDR-corrected p < 0.05).

