
Figure 2: Immunologic effects of abatacept on B and T cells.
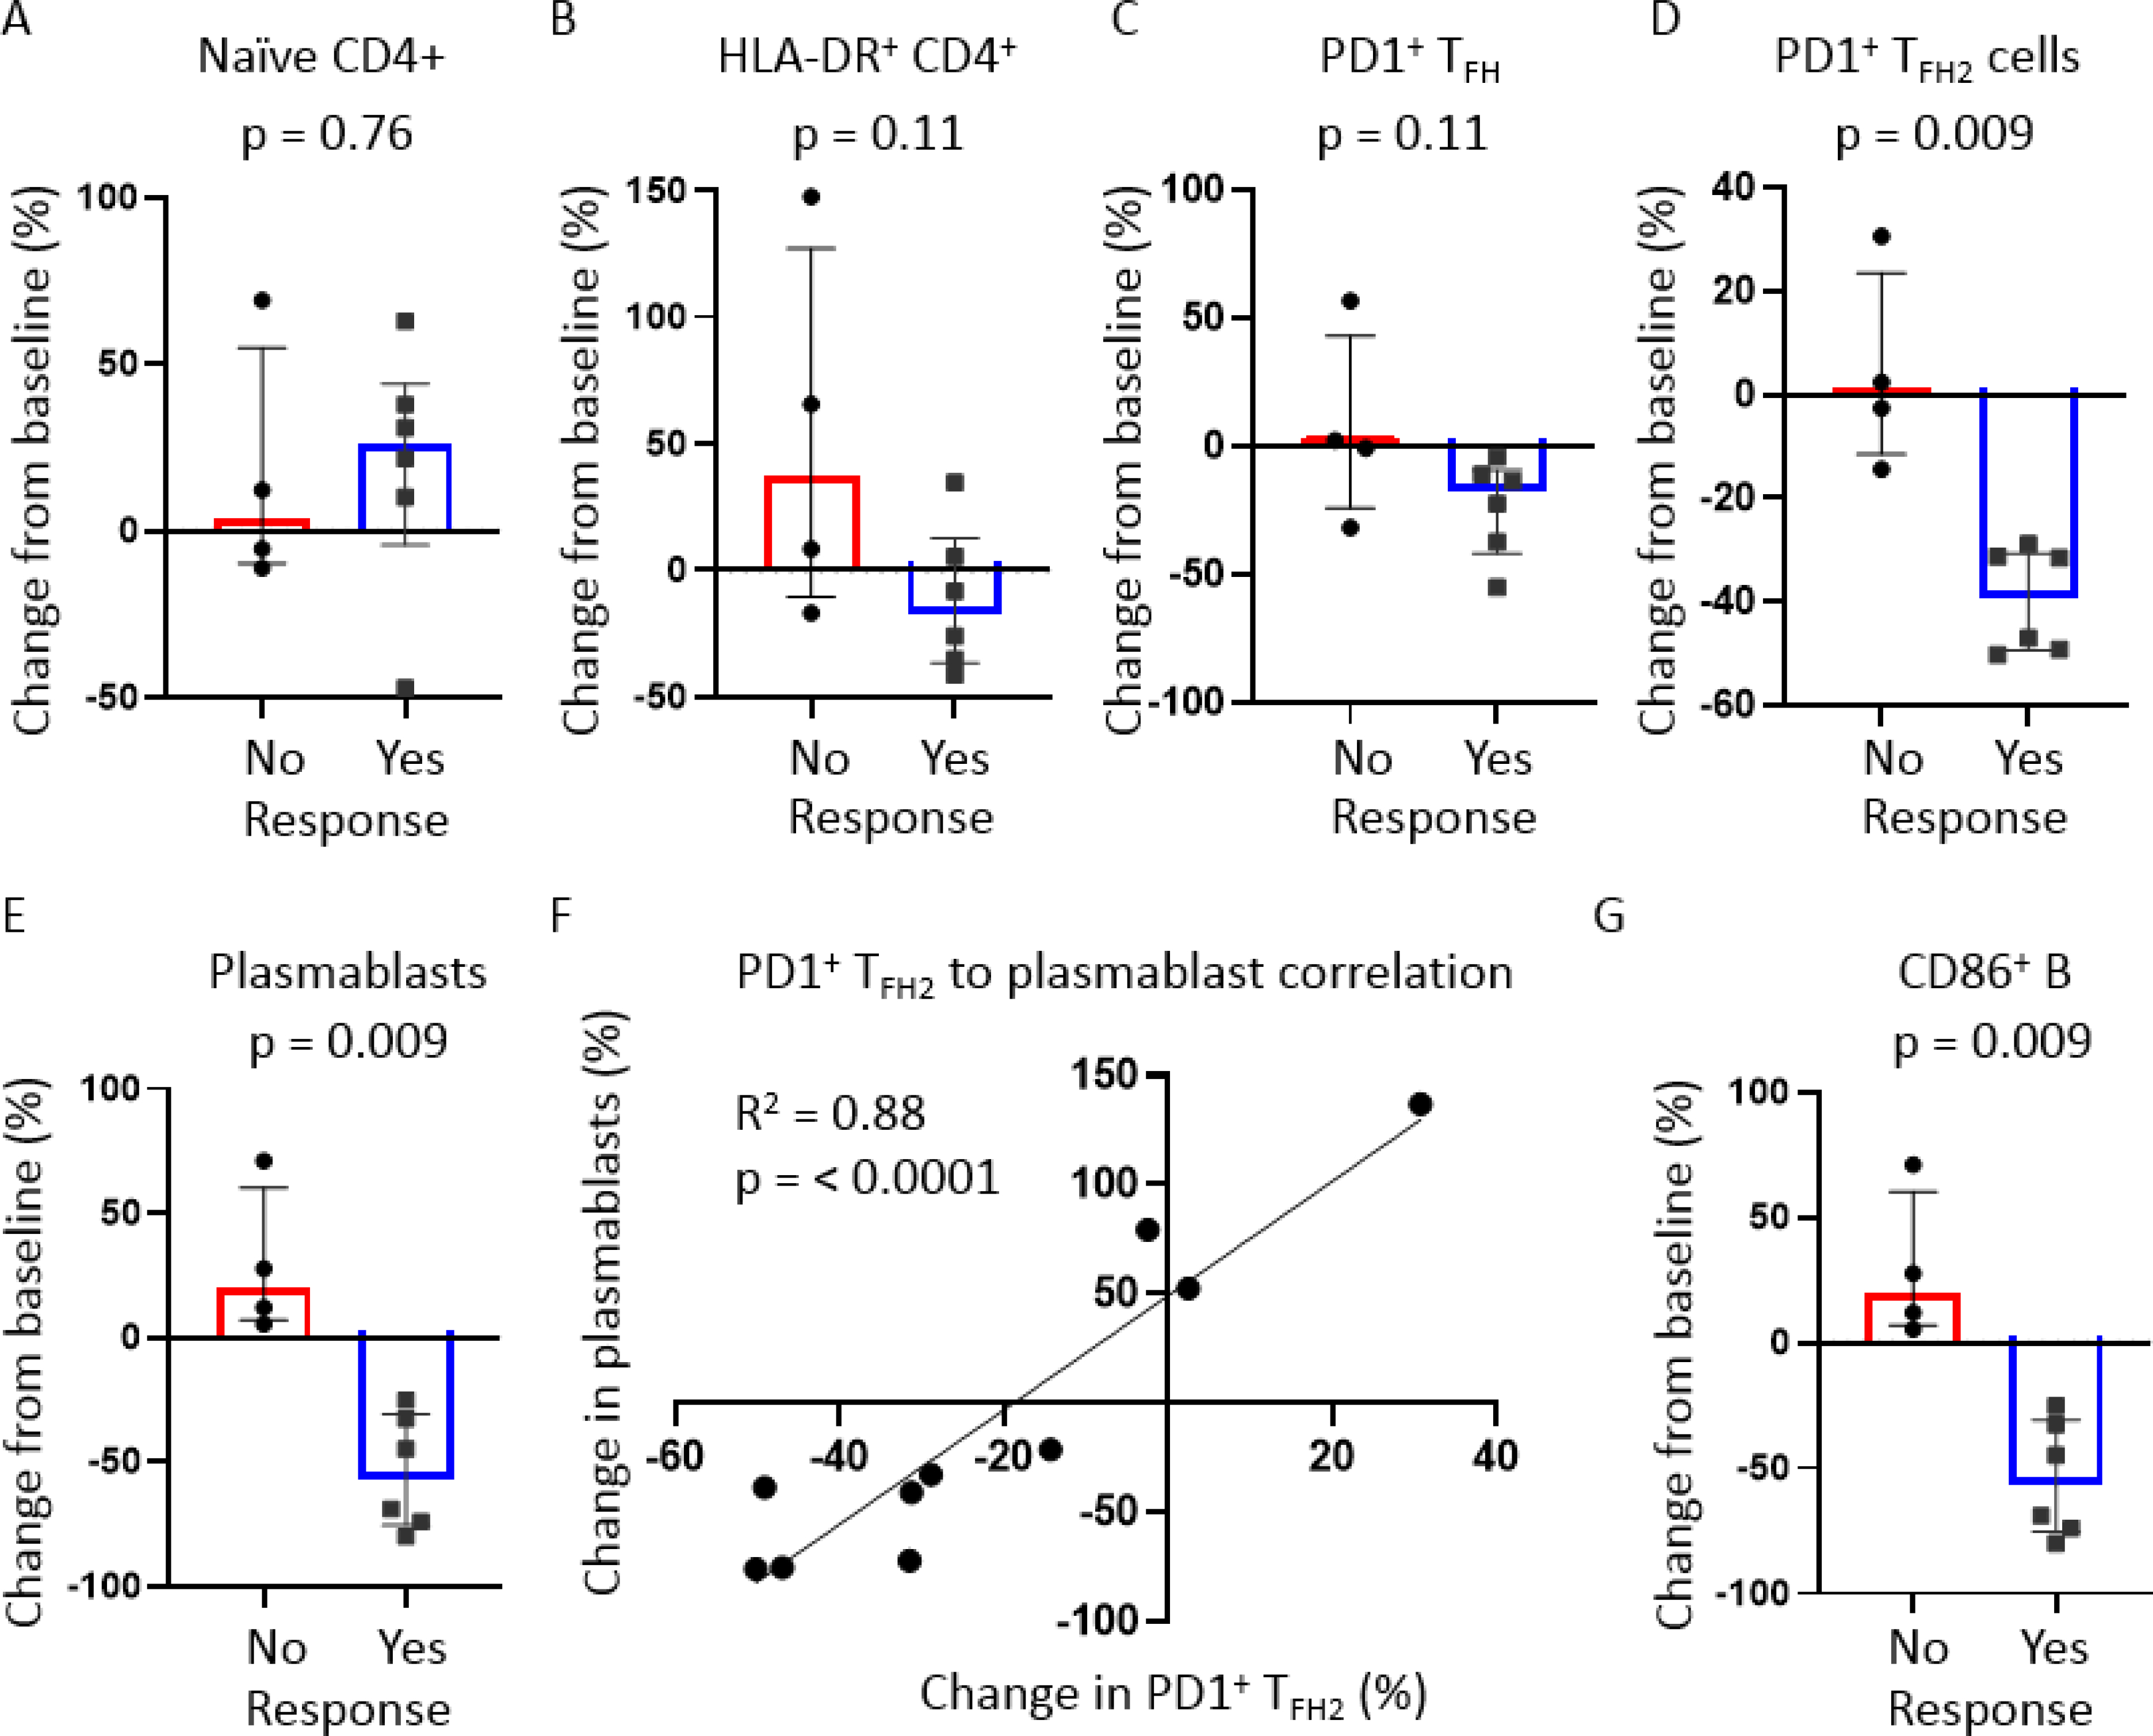
Dot plots of flow cytometry data displaying changes in relative proportions of respective T and B cell subsets from pre-to post-treatment time points. Blood samples from week 12 (or the latest time point prior to withdrawal if withdrawn prior to week 12) were used as post-treatment samples. Subjects were stratified based on clinical response to abatacept with ‘Yes’ indicating either a partial or complete clinical response. Dot plots displayed include A) naïve CD4+ T cells; B) Activated (HLA-DR+) CD4+ T cells; C) Effector (PD1+) circulating follicular helper T (TFH) cells; D) effector (PD1+) type 2 TFH; E) Plasmablasts (CD19+IgD−CD27+CD20LoCD38Hi); and G) CD86+ B cells. For all dot plot analyses, p-values were calculated by Mann-Whitney test. Bars represent medians and inter-quartile ranges. F) xy plot showing strong correlation between the pre- and post-treatment changes in plasmablasts and PD1+ TFH2 cells. p-value was calculated by linear regression. p-values <0.05 were considered significant.