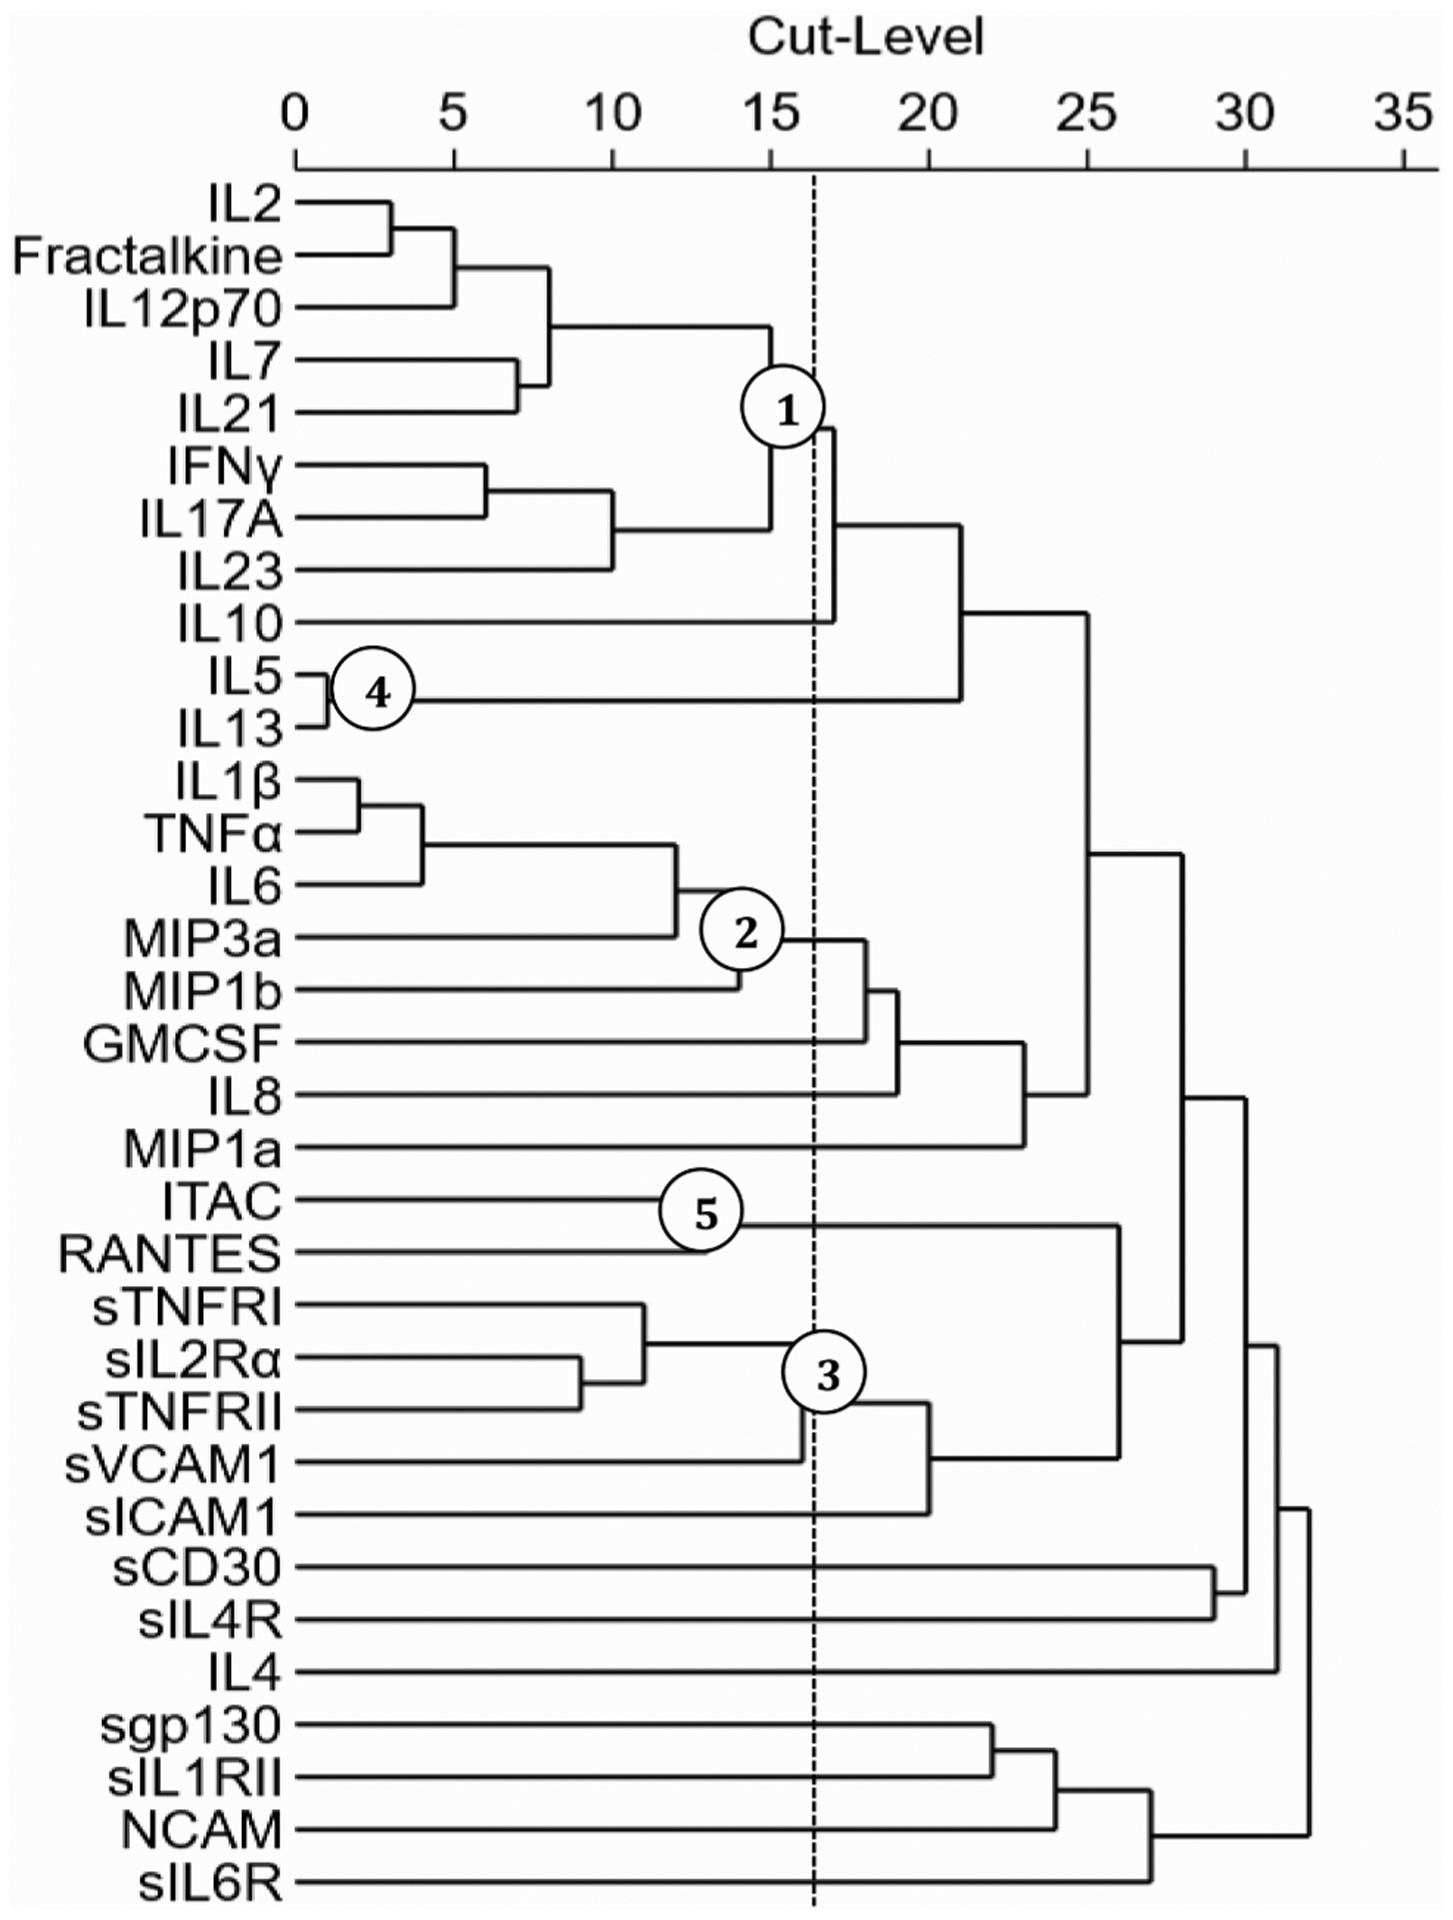
Fig. 3. Treelet Dendrogram.

The treelet cluster analysis created a Dendrogram for 33 inflammatory markers. The dotted vertical line depicts the cut-level used for the analysis (16), in which the last branch before the line contains a significant cluster (designated by circled node) of inflammatory markers.
