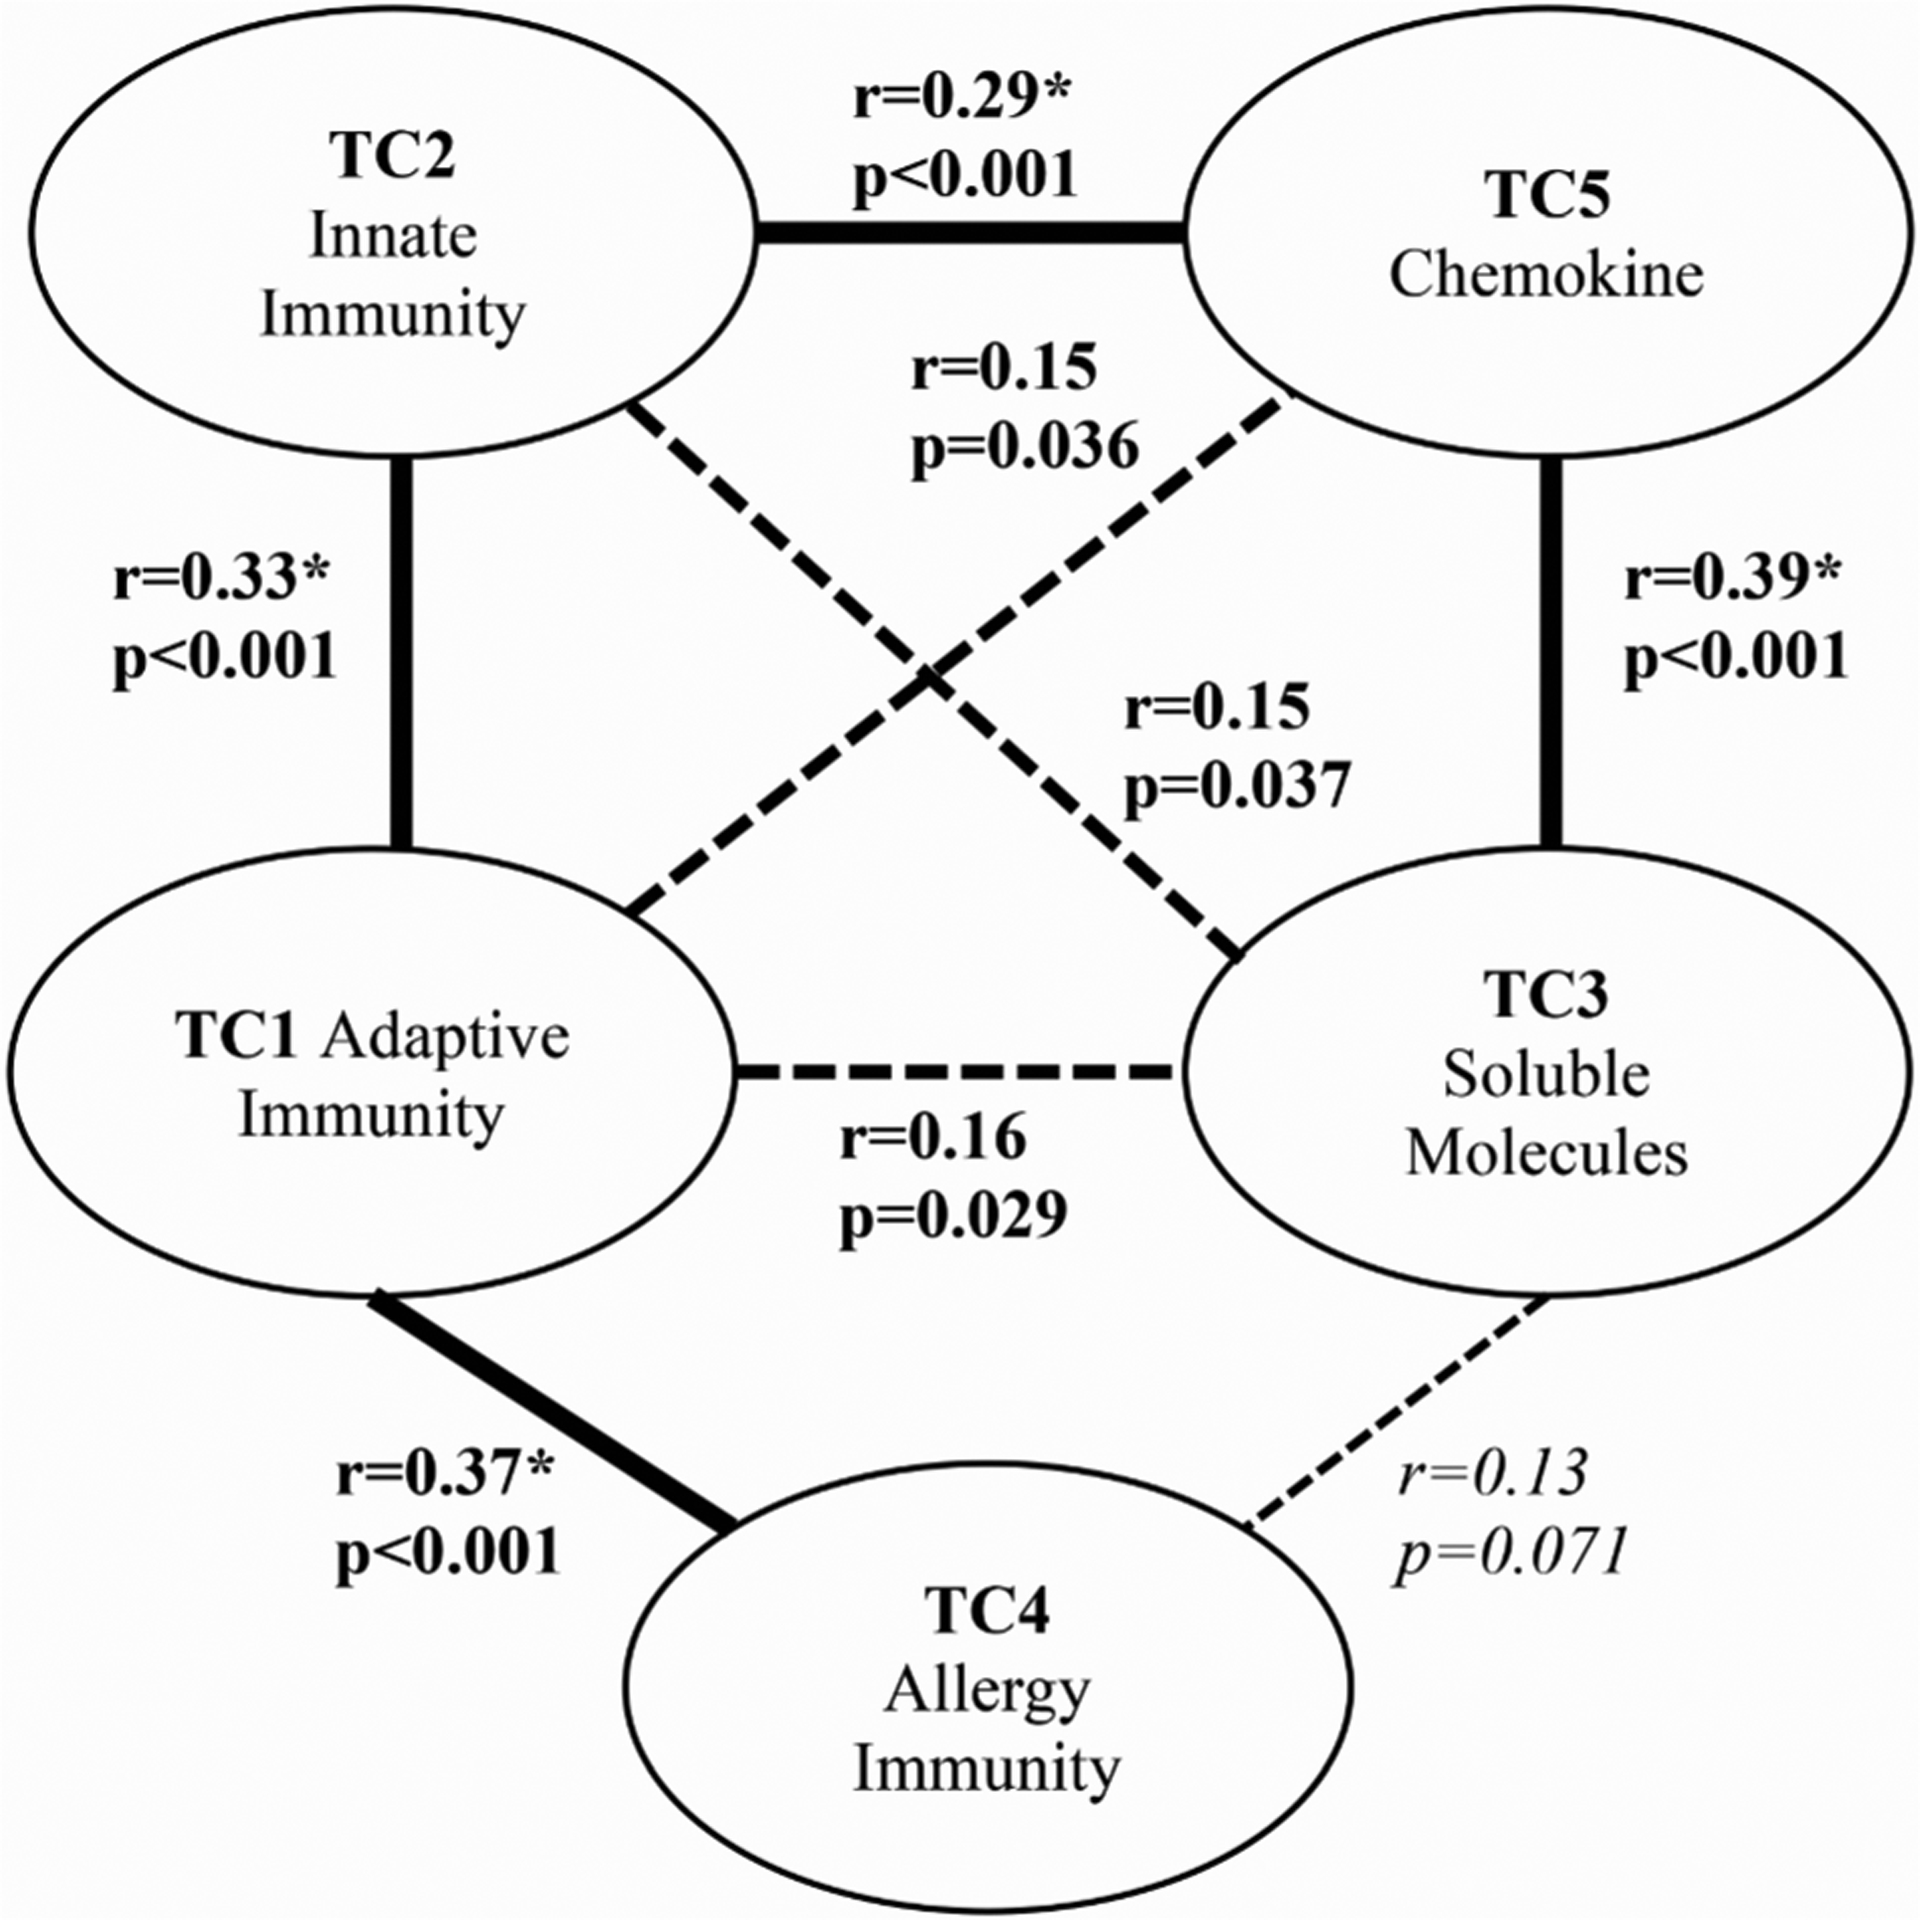
Fig. 4. Pearson Correlations Between TC Scores.

Correlations significant at the 10% level (p < 0.1) between TCs are shown. Lines between the cluster domains of immunity, are bolded if the relationship is moderately strong (r > 0.25) or dashed if the relationship is expressed to a weaker degree (p ≤ 0.1; r < 0.25). Non-significant relationships are not shown.
