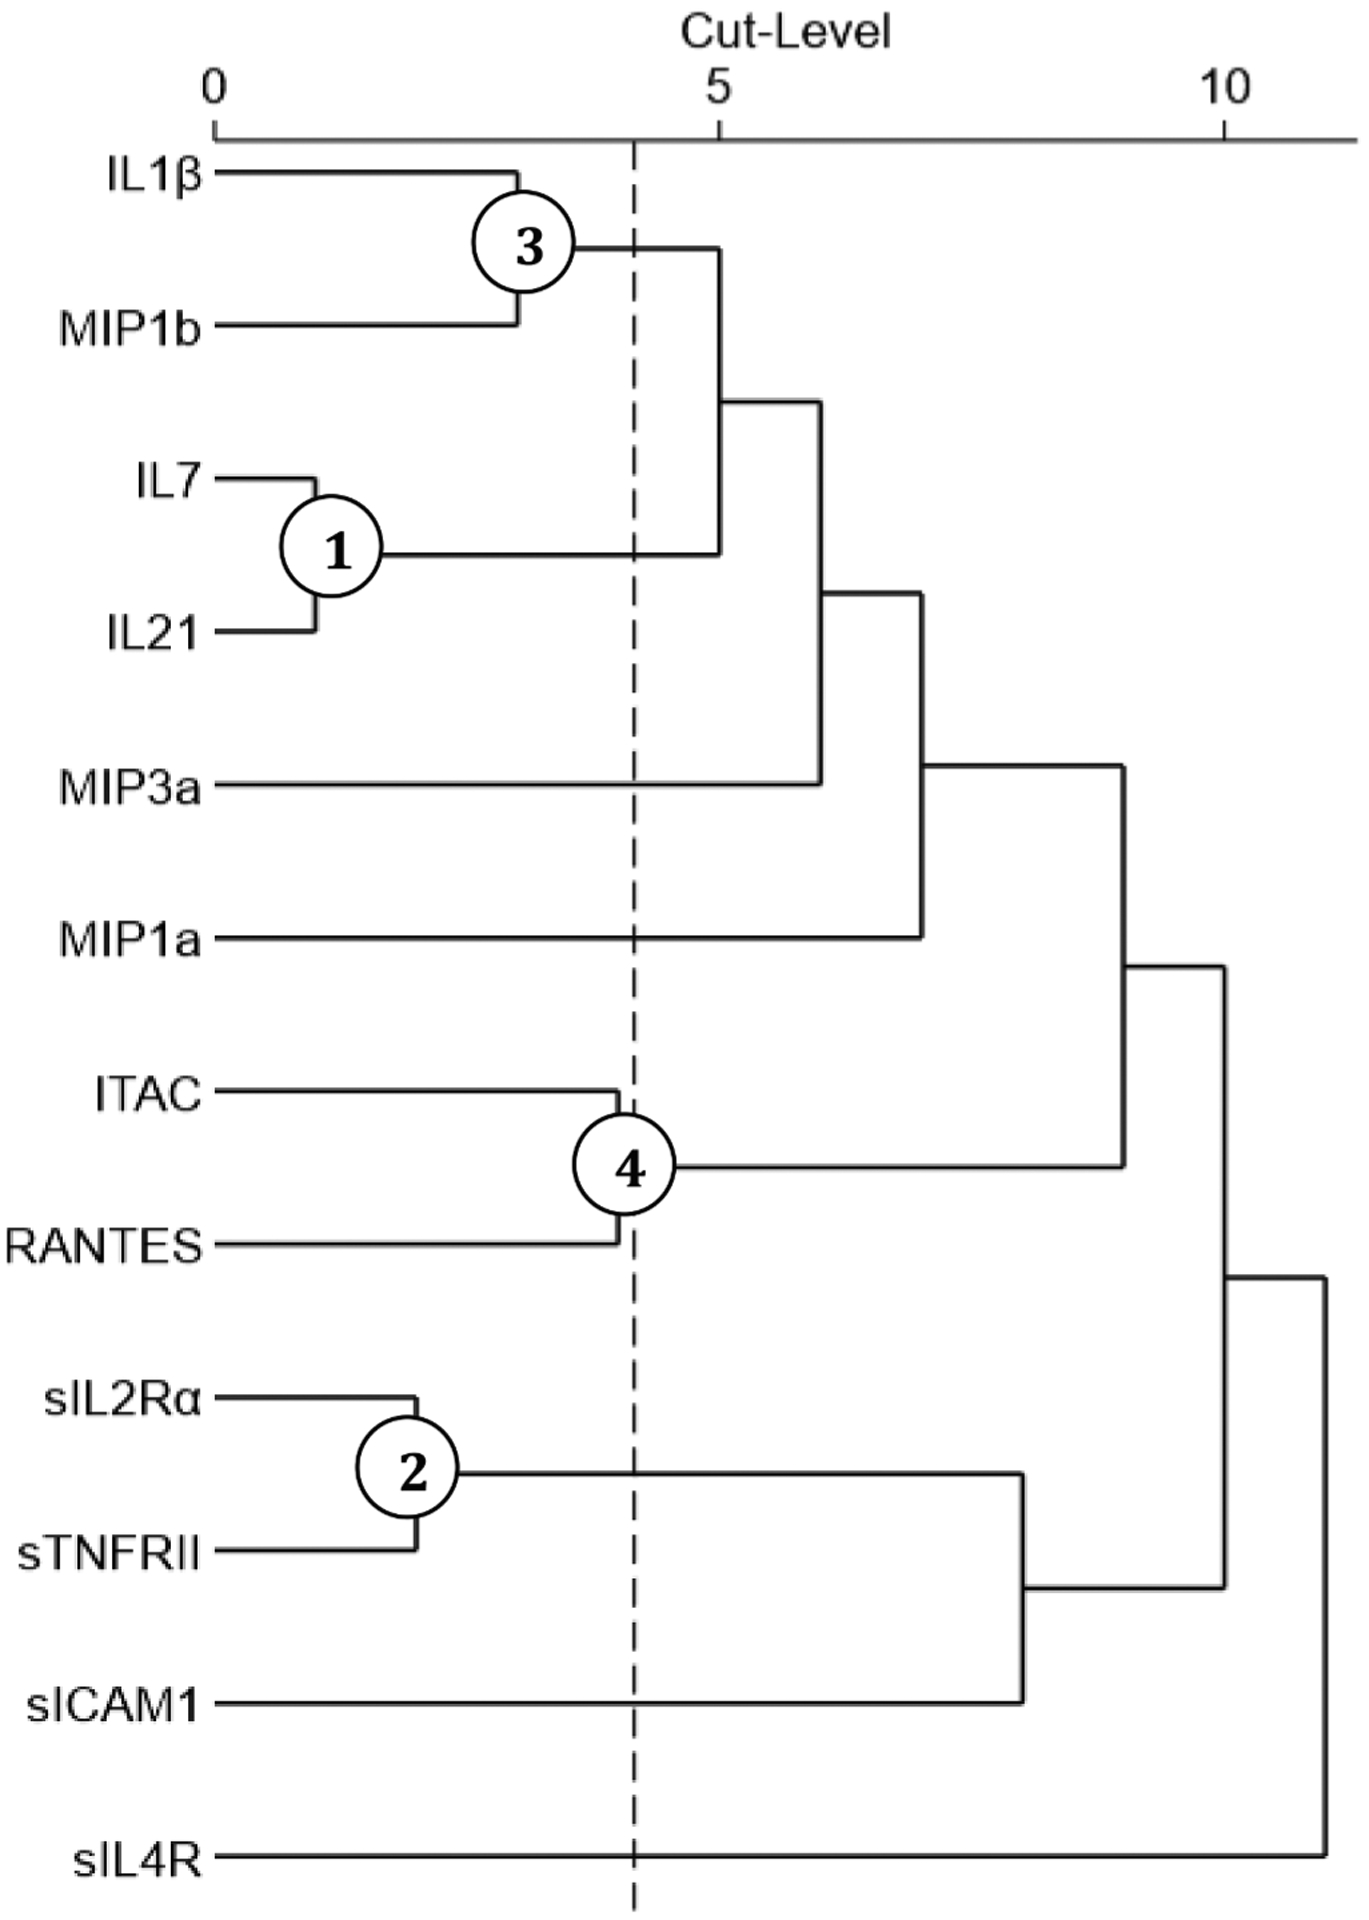
Fig. 5. Treelet Dendrogram of Inflammatory Markers Specific to 6-month GOS Score.

TT yielded the following correlation matrix for the subset of 12 inflammatory marker means associated (p < 0.1) with GOS outcome group. The dotted line depicts the optimal cut-level (4) and circled nodes represent significant clusters ranked by contribution to overall variance capture.
