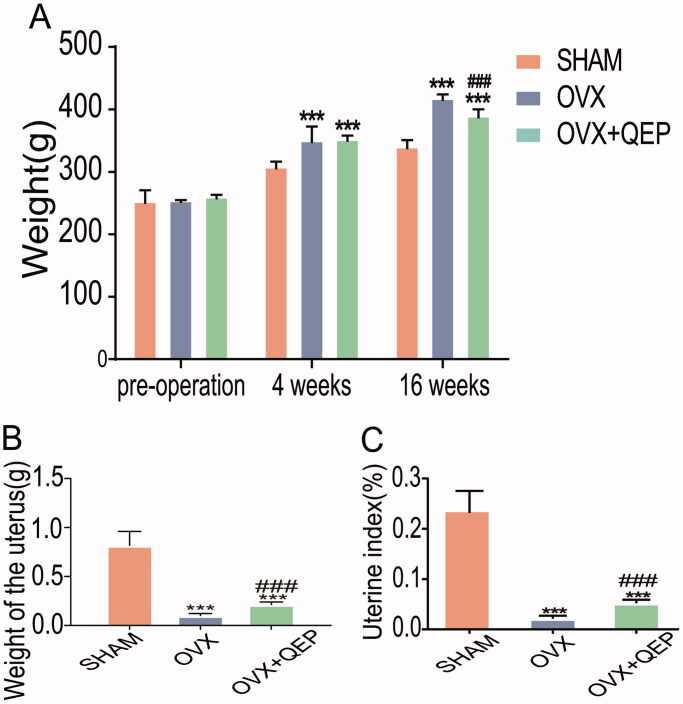
Figure 3.
Effects of QEP on body weight, uterine weight and uterine index. Comparison of (A) body weight, (B) uterine weight and (C) uterine index levels among the groups at 12 weeks post-operation. The data are expressed as means ± SD (n = 6 in each group). ***p < 0.001 vs. SHAM. ###p < 0.001 vs. OVX.

