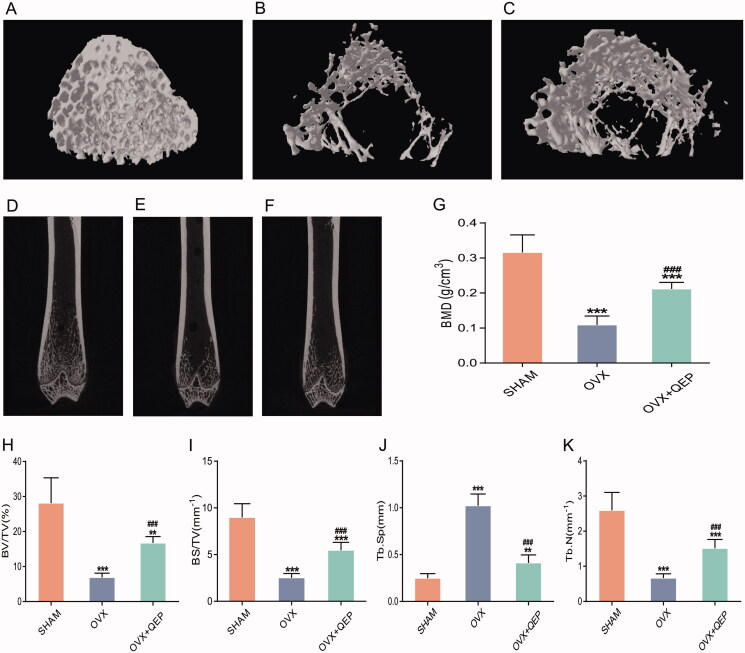
Figure 4.
QEP improved bone mass and bone microstructure in OVX rats. (A–C) Representative micro-CT images of femur. (D–F) Coronal view of the distal femur (G–K) Comparison of the BMD, BV/TV, BS/TV, Tb.Sp and Tb.N among the groups. The data are expressed as means ± SD (n = 6 in each group). **p < 0.01; ***p < 0. 001 vs. SHAM; ###p < 0.001 vs. OVX.

