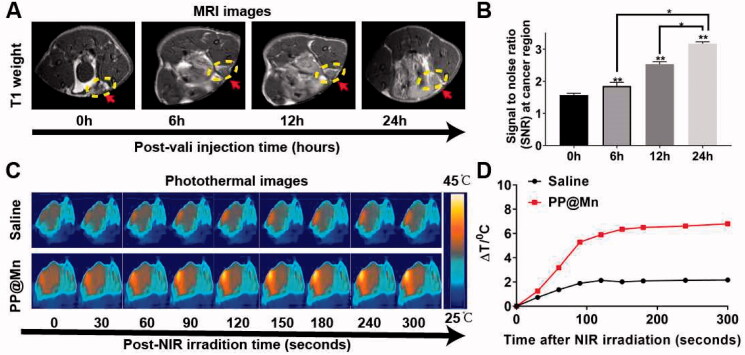
Figure 4.
In vivo MRI and PTT of the PP@Mn NPs. (A) In vivo T1-MRI of MFC tumor-bearing mice after tail intravenous injection of PP@Mn NP solutions. (B) Quantitative analysis of MRI in (A). (C) Infrared thermal images of MFC tumor-bearing mice treated with PP@Mn NPs and saline under NIR irradiation. (D) The temperature changes against time of MFC tumor-bearing mice in (C).

