. 2022 Feb 11;82(7):1234–1250. doi: 10.1158/0008-5472.CAN-21-1168

Figure 1.

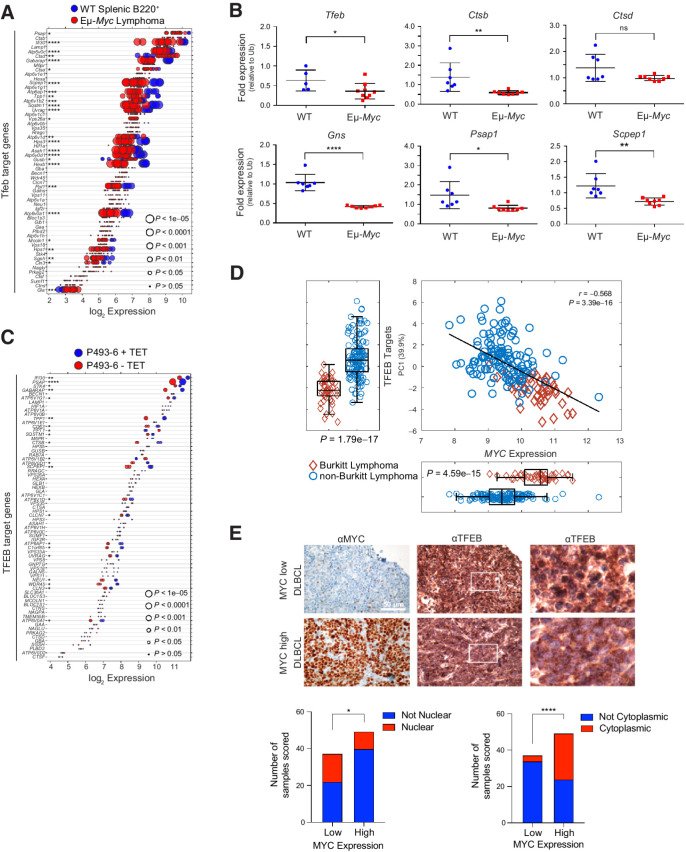
Figure 1. MYC suppresses the TFEB transcriptional program in B-cell lymphoma. A, Gene expression profile (GSE32239) comparing splenic B220+ B cells from WT (n = 4) and Eμ-Myc lymphomas (n = 13). Log2 gene expression of TFEB target genes are shown and are presented as a dot plot that is ordered on the basis of expression. Each dot represents one sample, and the size corresponds to its statistical significance as shown. B, qRT-PCR analyses of BM B220+ B cells from WT (blue symbols; n = 6) and premalignant Eμ-Myc mice (red symbols; n = 9) of Tfeb and select Tfeb target genes. C, Gene expression profile of TFEB target genes in human P493-6 B lymphoma cells (GSE40782) under either a MYC off state (n = 2) or MYC on state (n = 2). Log2 gene expression was plotted in a dot plot ordered on the basis of expression; each dot represents one sample, and its size corresponds to its statistical significance as shown. D, Gene expression profiling comparing 44 human Burkitt lymphoma and 129 human non-Burkitt B-cell lymphoma samples (GSE4475) for the log2 expression of MYC and TFEB target genes. The overall correlation of MYC expression to TFEB target genes is also shown. E, IHC staining of DLBCL samples classified as having low (n = 38) or high (n = 50) MYC expression with MYC and TFEB antibodies. TFEB staining was then classified and scored as either being localized to the nuclear (bottom left) or the cytoplasm (bottom right). Left and middle, scale bar, 50 μm. Right, magnified area of white outlined region of middle panels. Statistical analysis: B, Student t test was performed; F, Fisher exact test was performed. *, P ≤ 0.05; **, P ≤ 0.01; ****, P ≤ 0.0001; ns, nonsignificant.

MYC suppresses the TFEB transcriptional program in B-cell lymphoma. A, Gene expression profile (GSE32239) comparing splenic B220+ B cells from WT (n = 4) and Eμ-Myc lymphomas (n = 13). Log2 gene expression of TFEB target genes are shown and are presented as a dot plot that is ordered on the basis of expression. Each dot represents one sample, and the size corresponds to its statistical significance as shown. B, qRT-PCR analyses of BM B220+ B cells from WT (blue symbols; n = 6) and premalignant Eμ-Myc mice (red symbols; n = 9) of Tfeb and select Tfeb target genes. C, Gene expression profile of TFEB target genes in human P493-6 B lymphoma cells (GSE40782) under either a MYC off state (n = 2) or MYC on state (n = 2). Log2 gene expression was plotted in a dot plot ordered on the basis of expression; each dot represents one sample, and its size corresponds to its statistical significance as shown. D, Gene expression profiling comparing 44 human Burkitt lymphoma and 129 human non-Burkitt B-cell lymphoma samples (GSE4475) for the log2 expression of MYC and TFEB target genes. The overall correlation of MYC expression to TFEB target genes is also shown. E, IHC staining of DLBCL samples classified as having low (n = 38) or high (n = 50) MYC expression with MYC and TFEB antibodies. TFEB staining was then classified and scored as either being localized to the nuclear (bottom left) or the cytoplasm (bottom right). Left and middle, scale bar, 50 μm. Right, magnified area of white outlined region of middle panels. Statistical analysis: B, Student t test was performed; F, Fisher exact test was performed. *, P ≤ 0.05; **, P ≤ 0.01; ****, P ≤ 0.0001; ns, nonsignificant.