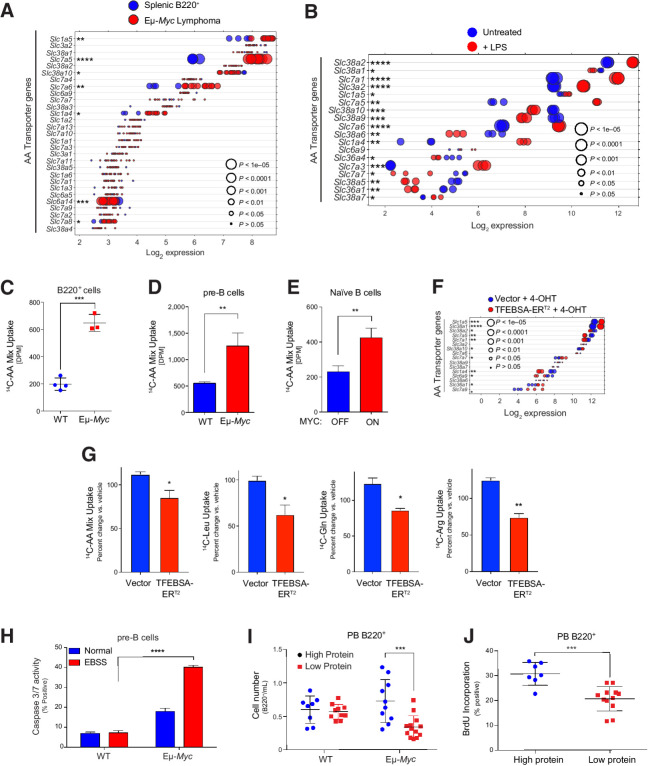
Figure 6.
MYC induces expression and activity of select AA transporters in B lymphoma. A and B, Gene expression of AA transporters in splenic WT and neoplastic Eμ-Myc B cells (GSE32239; A), and untreated and LPS-stimulated mouse splenic B cells (GSE37222; B). Log2 mRNA levels are shown in a dot plot that is ordered on the basis of expression; each dot represents one sample, and the size corresponds to its statistical significance as shown. C–E, Uptake of 14C-labeled amino acids in WT vs. Eμ-Myc B220+ BM cells (C); WT versus Eμ-Myc pre-B cells cultured in IL7 (D); and untreated (MYC-Off) or LPS-stimulated (4 hours, MYC-ON) primary splenic B cells (E). F, Log2 gene expression profile of genes encoding select AA transporters is shown in a dot plot ordered on the basis of their expression in Eμ-Myc lymphoma cells expressing vector or TFEBSA-ERT2 4 days after treatment with vehicle or 4-OHT; each dot represents one sample, and its size corresponds to its statistical significance as shown. G, Uptake of indicated 14C-labeled AAs in Eμ-Myc lymphoma cells expressing vector or TFEBSA-ERT2 after treatment with vehicle or 4-OHT (4 days). H, Pre-B cells isolated from WT versus Eμ-Myc mice were plated in normal or EBSS media for 3 hours and apoptosis measured via caspase-3/7 activity. I, WT and Eμ-Myc littermate mice were switched to a chow containing either high (20%) or low (6%) protein 3 weeks after birth. The number of peripheral blood (PB) B220+ cells were determined after 1 week. J, Six-weeks-old WT and Eμ-Myc littermate mice were switched to a chow containing either high (20%) or low (6%) protein for 1 week and were then injected intravenously with BrdU and incorporation was measured in PB B220+ cells. Statistical analysis: C–E and G–J, Student t tests were performed. *, P ≤ 0.05; **, P ≤ 0.01; ***, P ≤ 0.001; ****, P ≤ 0.0001.

