. 2022 Feb 11;82(7):1234–1250. doi: 10.1158/0008-5472.CAN-21-1168

Figure 7.

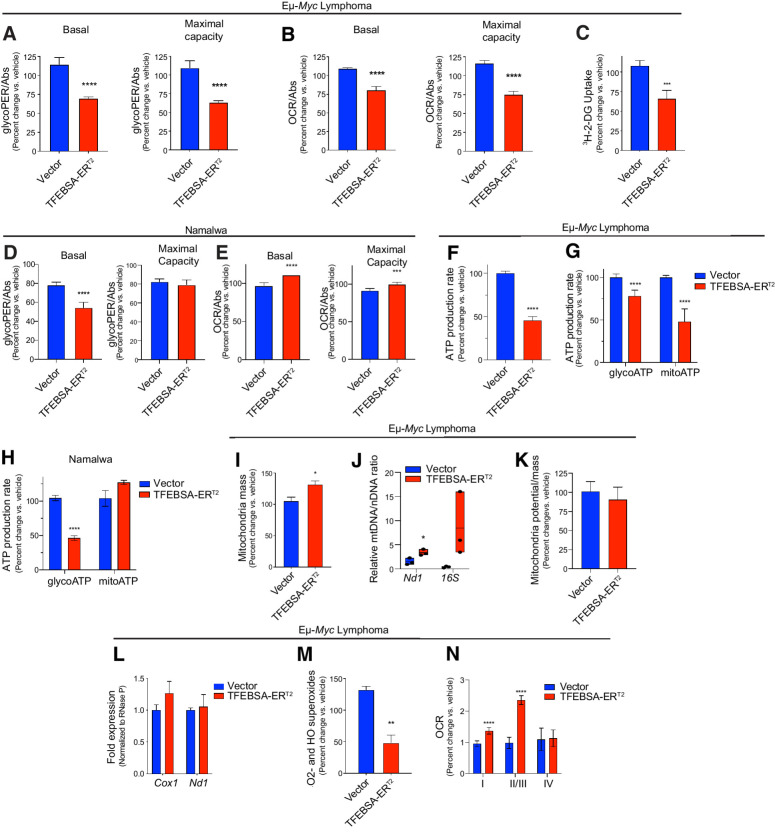
Figure 7. Induction of TFEB compromises the metabolism in MYC-driven B-cell lymphoma. A–C, The basal and maximal capacity for aerobic glycolysis (A; GRAs), basal and maximal capacity for oxidative phosphorylation (B; mitochondrial stress tests), and uptake of 3H-2-deoxy-D-glucose (C) were measured in Eμ-Myc lymphoma cells expressing vector or TFEBSA-ERT2 after treatment with vehicle or 4-OHT for 4 days (n = 6–8). D and E, The basal and maximal capacity for aerobic glycolysis (D), and basal and maximal capacity for oxidative phosphorylation (E) were measured using the XFe96 Analyzer in Namalwa BL cells expressing vector or TFEBSA-ERT2 after treatment with vehicle or 4-OHT for 6 days (n = 3). F–H, Total (F), glycolytic (glycoATP) and mitochondrial (mitoATP; G and H) real-time ATP production were determined in Eμ-Myc lymphoma (F and G) or Namalwa BL (H) cells expressing vector or TFEBSA-ERT2 after treatment with vehicle or 4-OHT for 4 days (F and G; n = 6–8) or 6 days (H; n = 3) using the XFe96 Analyzer. I–M, Eμ-Myc lymphoma–expressing vector or TFEBSA-ERT2 was treated with vehicle or 4-OHT for 4 days and assessed for mitochondrial mass by staining with MitoTracker Green (I); the relative ratio of mitochondrial (Nd1, 16S) to nuclear (HK2) gene DNA content by qPCR (J); mitochondrial membrane potential (K); the expression of mitochondrial Nd1 and Cox1 genes by qRT-PCR (L); and mitochondrial superoxide levels (CellRox; n = 3; M). N, Analysis of ETC complex I, II, III, and IV activity in mitochondria isolated from Eμ-Myc lymphoma–expressing vector or TFEBSA-ERT2 after treatment with vehicle or 4-OHT for 4 days (n = 6–8). Basal OCR readings were used to determine for complex I activity. Injections of 2 μmol/L rotenone and 10 mmol/L succinate were performed to analyze complex II/III activity. Complex IV activity was analyzed by injecting 2 μmol/L antimycin A, 10 mmol/L ascorbate (A4034), and 100 μmol/L TMPD (T7394). Statistical analysis: A–N, Student t tests were performed. *, P ≤ 0.05; **, P ≤ 0.01; ***; P ≤ 0.001; ****, P ≤ 0.0001.

Induction of TFEB compromises the metabolism in MYC-driven B-cell lymphoma. A–C, The basal and maximal capacity for aerobic glycolysis (A; GRAs), basal and maximal capacity for oxidative phosphorylation (B; mitochondrial stress tests), and uptake of 3H-2-deoxy-D-glucose (C) were measured in Eμ-Myc lymphoma cells expressing vector or TFEBSA-ERT2 after treatment with vehicle or 4-OHT for 4 days (n = 6–8). D and E, The basal and maximal capacity for aerobic glycolysis (D), and basal and maximal capacity for oxidative phosphorylation (E) were measured using the XFe96 Analyzer in Namalwa BL cells expressing vector or TFEBSA-ERT2 after treatment with vehicle or 4-OHT for 6 days (n = 3). FH, Total (F), glycolytic (glycoATP) and mitochondrial (mitoATP; G and H) real-time ATP production were determined in Eμ-Myc lymphoma (F and G) or Namalwa BL (H) cells expressing vector or TFEBSA-ERT2 after treatment with vehicle or 4-OHT for 4 days (F and G; n = 6–8) or 6 days (H; n = 3) using the XFe96 Analyzer. IM, Eμ-Myc lymphoma–expressing vector or TFEBSA-ERT2 was treated with vehicle or 4-OHT for 4 days and assessed for mitochondrial mass by staining with MitoTracker Green (I); the relative ratio of mitochondrial (Nd1, 16S) to nuclear (HK2) gene DNA content by qPCR (J); mitochondrial membrane potential (K); the expression of mitochondrial Nd1 and Cox1 genes by qRT-PCR (L); and mitochondrial superoxide levels (CellRox; n = 3; M). N, Analysis of ETC complex I, II, III, and IV activity in mitochondria isolated from Eμ-Myc lymphoma–expressing vector or TFEBSA-ERT2 after treatment with vehicle or 4-OHT for 4 days (n = 6–8). Basal OCR readings were used to determine for complex I activity. Injections of 2 μmol/L rotenone and 10 mmol/L succinate were performed to analyze complex II/III activity. Complex IV activity was analyzed by injecting 2 μmol/L antimycin A, 10 mmol/L ascorbate (A4034), and 100 μmol/L TMPD (T7394). Statistical analysis: A–N, Student t tests were performed. *, P ≤ 0.05; **, P ≤ 0.01; ***; P ≤ 0.001; ****, P ≤ 0.0001.