. 2022 Feb 11;82(7):1234–1250. doi: 10.1158/0008-5472.CAN-21-1168

Figure 8.

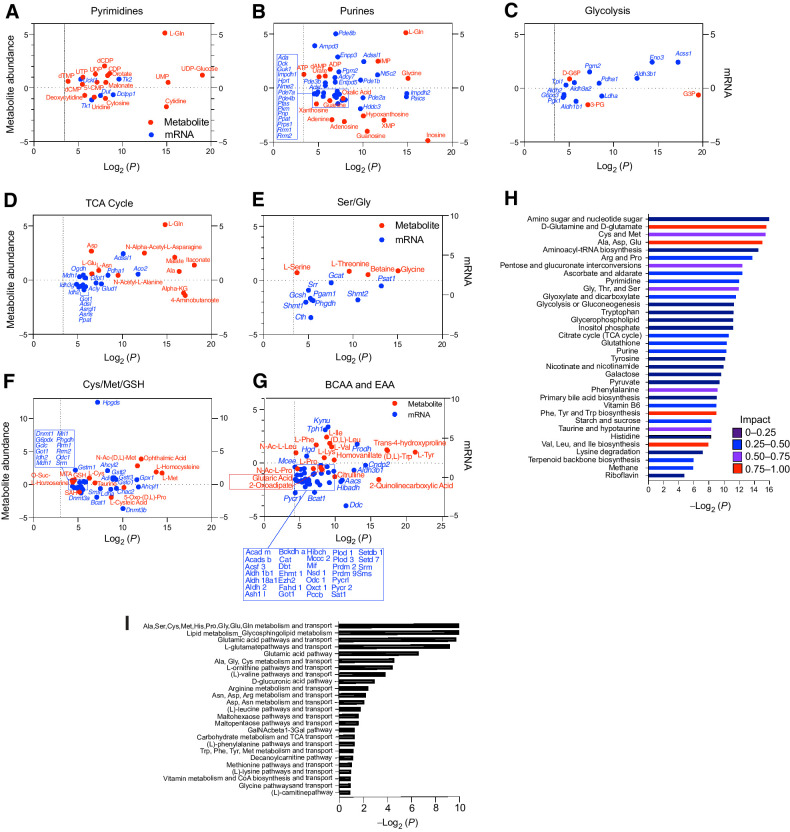
Figure 8. TFEB provokes metabolic anergy in MYC-induced B-cell lymphoma. A–G, Differential and statistically significant metabolites and genes (P ≤ 0.1 and P ≤ 0.05, respectively) were grouped on the basis of the indicated KEGG metabolic pathways and are illustrated as two-axis dot plots to show the metabolite abundance (left axis of plots) and changes in mRNA expression (right axis of plots) that were upregulated or downregulated following the induction of TFEB activity in Eμ-Myc lymphoma cells. H, Untargeted metabolomic profiling via LC/MS-MS was performed in Eμ-Myc lymphoma–expressing vector or TFEBSA-ERT2 after treatment with vehicle or 4-OHT for 4 days (n = 4). LC/MS spectra was analyzed using MZMine2. These data were then uploaded into MetaboAnalyst, and samples were normalized by the sum of all metabolites and log2 transformed, followed by a functional enrichment analysis to assess metabolic pathway enrichment using MetaboAnalyst. I, Normalized log2-transformed metabolomic data from Eμ-Myc lymphoma–expressing TFEBSA-ERT2 treated with vehicle or 4-OHT were uploaded to GeneGo MetaCore to assess metabolic pathways affected by TFEB activation.

TFEB provokes metabolic anergy in MYC-induced B-cell lymphoma. A–G, Differential and statistically significant metabolites and genes (P ≤ 0.1 and P ≤ 0.05, respectively) were grouped on the basis of the indicated KEGG metabolic pathways and are illustrated as two-axis dot plots to show the metabolite abundance (left axis of plots) and changes in mRNA expression (right axis of plots) that were upregulated or downregulated following the induction of TFEB activity in Eμ-Myc lymphoma cells. H, Untargeted metabolomic profiling via LC/MS-MS was performed in Eμ-Myc lymphoma–expressing vector or TFEBSA-ERT2 after treatment with vehicle or 4-OHT for 4 days (n = 4). LC/MS spectra was analyzed using MZMine2. These data were then uploaded into MetaboAnalyst, and samples were normalized by the sum of all metabolites and log2 transformed, followed by a functional enrichment analysis to assess metabolic pathway enrichment using MetaboAnalyst. I, Normalized log2-transformed metabolomic data from Eμ-Myc lymphoma–expressing TFEBSA-ERT2 treated with vehicle or 4-OHT were uploaded to GeneGo MetaCore to assess metabolic pathways affected by TFEB activation.