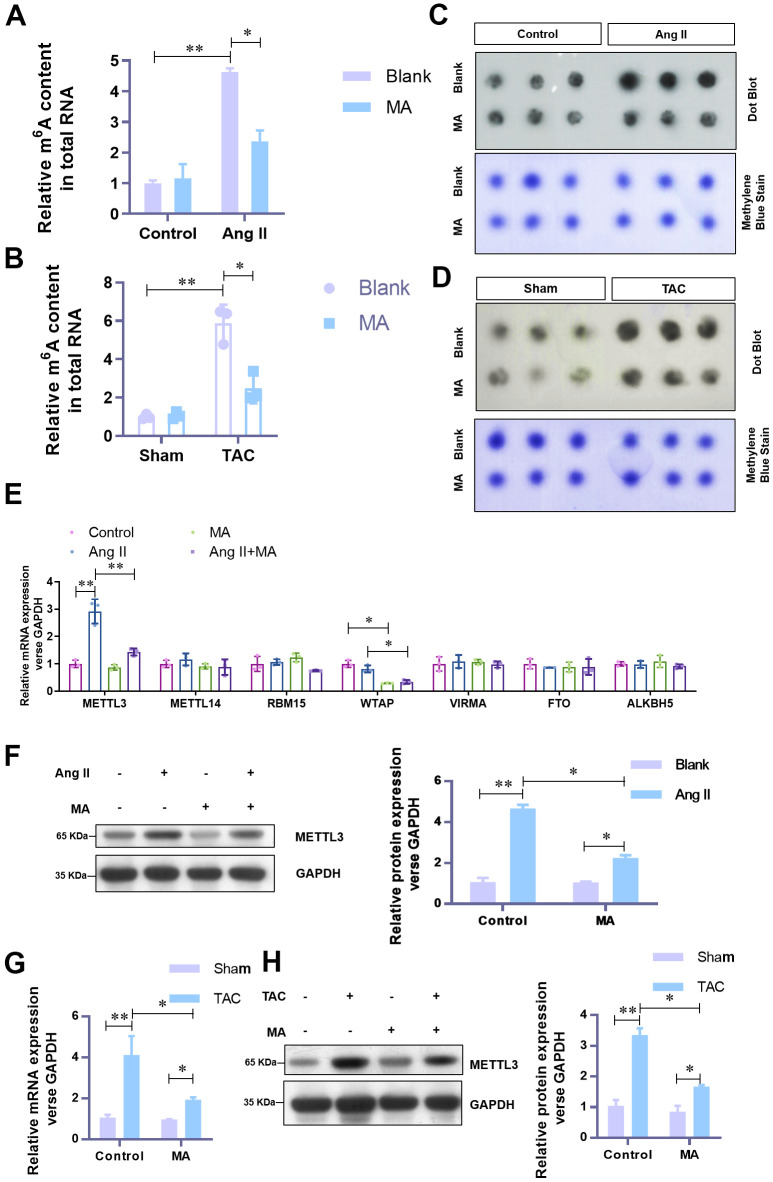
Figure 3.
MA-induced significant impairment of the elevated level of m6A methylation and METTL3 in hypertrophic cardiomyocytes in vitro and in vivo. (A) The effect of MA on the total RNA m6A methylation content in Ang-II induced hypertrophic NMCMs and (B) TAC induced hypertrophic LV tissues (detected with the EpiQuik m6A RNA Methylation assay kit). (C) The effect of MA on the total RNA m6A methylation content in Ang-II induced hypertrophic NMCMs and (D) TAC induced hypertrophic LV tissues (detected with by Dot Blot). Methylene blue staining served as a loading control. (E) Real-time PCR analysis of the mRNA expression levels of the major methyltransferases (METTL3, METTL14, RBM15, WTAP, VIRMA) and demethylases (FTO and ALKBH5). (F) Western blot analysis of the effect of MA on the protein level of METTL3 in Ang-II induced hypertrophic NMCMs. (G) Real-time PCR analysis of the effect of MA on the protein level of METTL3 in TAC induced hypertrophic LV tissues. (H) Western blot detection of the effect of MA on the protein level of METTL3 in TAC-induced hypertrophic LV tissues; *P<0.05, **P<0.01 compared with the indicated group.

