
Fig. 2.
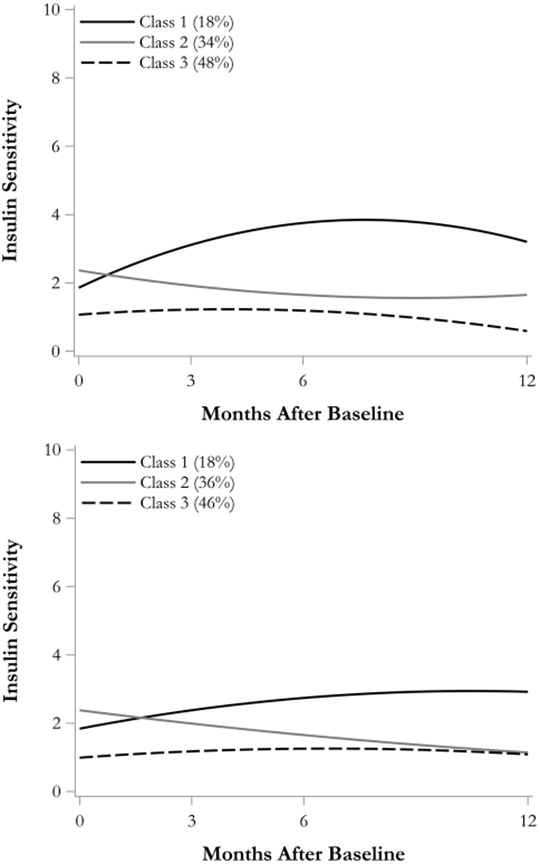
Plot of class-specific growth trajectories for 3-class solution of CPGMM from full data (N = 90; top panel) and from the data with outliers removed (N = 85; bottom panel)
Official websites use .gov
A
.gov website belongs to an official
government organization in the United States.
Secure .gov websites use HTTPS
A lock (
) or https:// means you've safely
connected to the .gov website. Share sensitive
information only on official, secure websites.
Plot of class-specific growth trajectories for 3-class solution of CPGMM from full data (N = 90; top panel) and from the data with outliers removed (N = 85; bottom panel)