
Fig. 3.
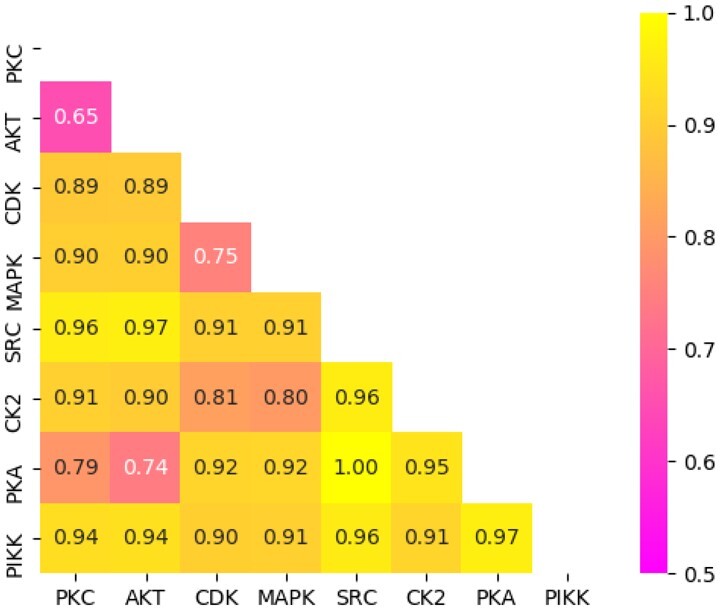
Heatmap matrix depicting pairwise kinase-domain distances. Levenshtein distances were normalized, with the yellow end of the color bar representing far distances (less similar) and the pink end representing close distances (more similar)
Official websites use .gov
A
.gov website belongs to an official
government organization in the United States.
Secure .gov websites use HTTPS
A lock (
) or https:// means you've safely
connected to the .gov website. Share sensitive
information only on official, secure websites.
Heatmap matrix depicting pairwise kinase-domain distances. Levenshtein distances were normalized, with the yellow end of the color bar representing far distances (less similar) and the pink end representing close distances (more similar)