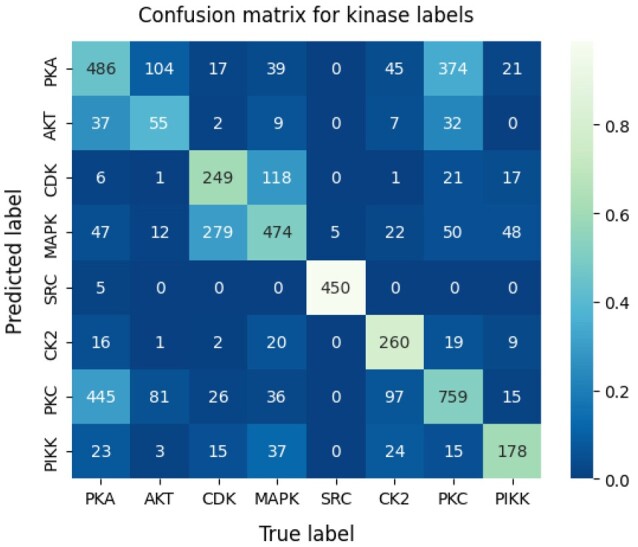
Fig. 6.

Confusion matrix for EMBER predictions on the test set. The numbers inside each box represent the raw number of predictions per box. The color scale is based on the ratio of predictions (in the corresponding box) to total predictions, per label. A lighter color corresponds to a larger ratio of predictions to total predictions
