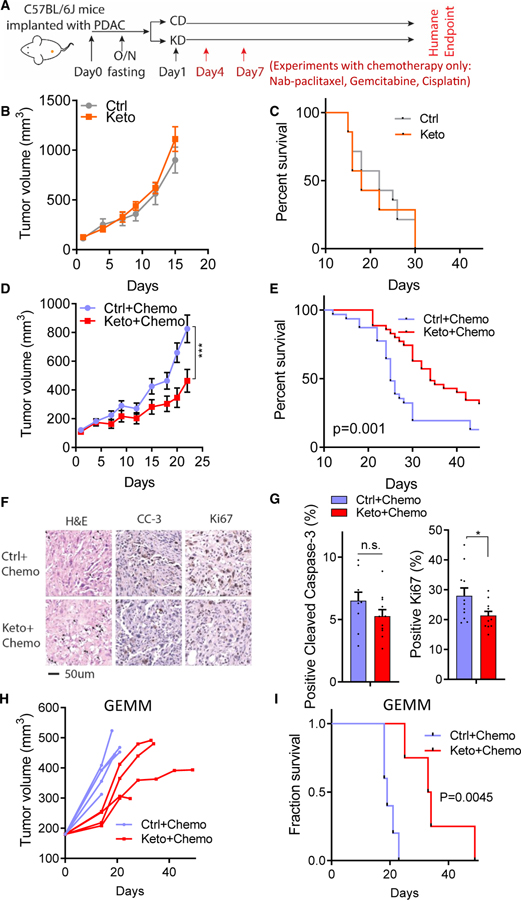
Figure 3. Ketogenic diet synergizes with cytotoxic chemotherapy.
(A) Chemotherapy regimen (triple chemotherapy: nab-paclitaxel, gemcitabine, cisplatin) with doses administered on day 4 and day 7 after diet switch in C57BL/6 mice with KPC tumor chunk allografts.
(B): Tumor volumes for diet only without chemotherapy (batch #2, mean ± SEM, n = 8 mice per group).
(C) Kaplan-Meier curve for diet only without chemotherapy (n = 14 mice per group).
(D) Allograft tumor volumes in mice treated with control diet plus chemotherapy or ketogenic diet plus chemotherapy (batch #2, mean ± SEM, n = 11 mice per group; for other batches, see Figure S3B).
(E) Kaplan-Meier curve for mice treated with control diet plus chemotherapy or ketogenic diet plus chemotherapy (n = 31 mice for Ctrl + Chemo and n = 35 mice for Keto + Chemo).
(F) Representative H&E staining, cleaved caspase-3 staining, and Ki67 staining from tumor tissue treated with control diet plus chemotherapy or ketogenic diet plus chemotherapy. Scale bar, 50 μm.
(G) Quantification of cleaved caspase-3-positive cells and Ki67-positive cells within tumor tissues from (F) (n = 10 images for Ctrl + Chemo and n = 10 images for Keto + Chemo group).
(H) Primary tumor volumes in KPC genetically engineered mouse model (GEMM) (each line represents one mouse).
(I) Kaplan-Meier curve for KPC GEMM (n = 5 for Ctrl + Chemo group, n = 4 for Keto + Chemo group).
*p < 0.05, ***p < 0.001. Two-way ANOVA in (B); log-rank (Mantel-Cox) test in (C), (E), and (I); two-tailed Student’s t test in (G). n.s., not significant. See also Figure S3.

