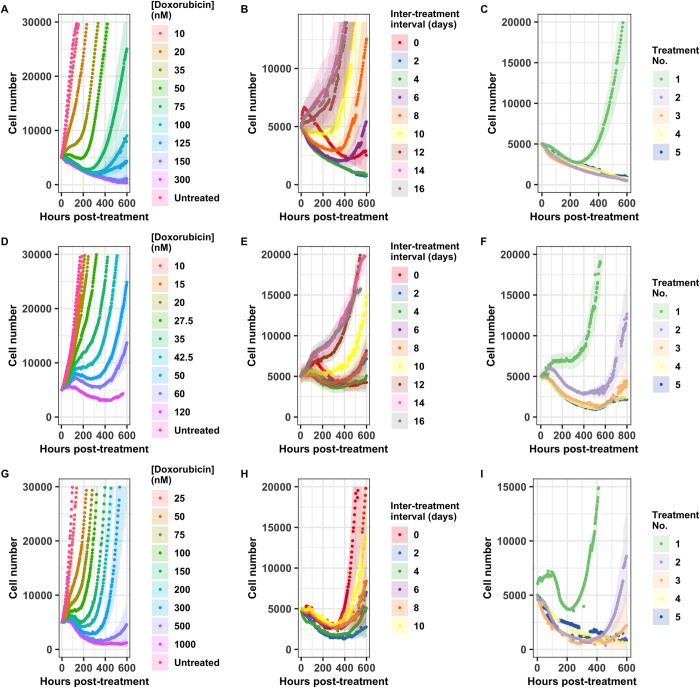
Fig 3. Cell population response to doxorubicin regimens.
Population level response to 24 hour doxorubicin exposures is quantified as doxorubicin concentration varies in the MCF7 cell line (A), the BT474 cell line (D), and the MDA-MB-231 cell line (G), as the interval between two 24 hour doxorubicin exposures varies at 75 nM in the MCF7 cell line (B), at 35 nM in the BT474 cell line (E), and at 200 nM in the MDA-MB-231 cell line (H), and as the number of sequential 24 hour doxorubicin exposures varies at a two day interval and 75 nM in the MCF7 cell line (C), at a zero day interval (continuous exposure) and 35 nM in the BT474 cell line (F), and at a two day interval and 200 nM in the MDA-MB-231 cell line (I). Each curve represents the average of six (A, D, G) or 12 (B, C, E, F, H, I) replicate samples, and 95% confidence intervals are marked by the shaded regions. All curves are aligned such that t = 0 is the beginning of the final drug exposure for that treatment group.

