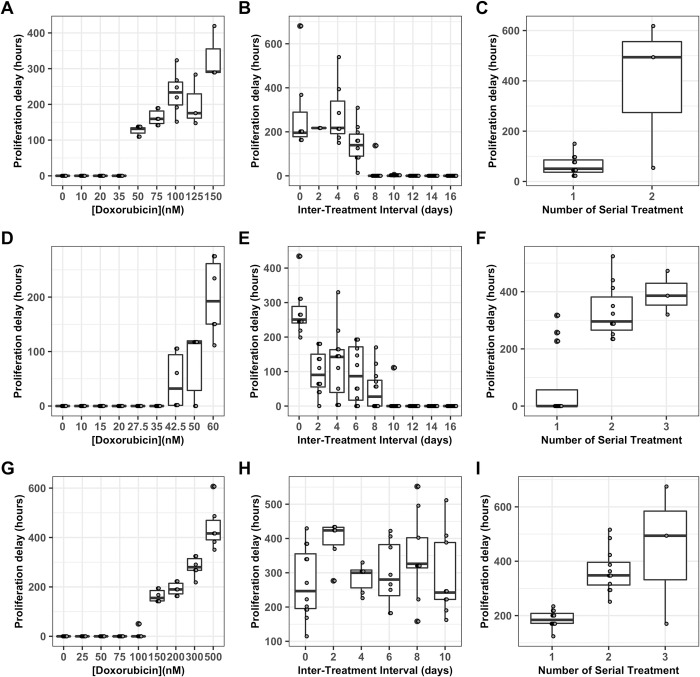
Fig 5. Proliferation delay, tr varies with dosing regimen.
Length of growth arrest of resistant cells (tr) is displayed as a Tukey box-and-whiskers plot as doxorubicin concentration varies in the MCF7 cell line (A), the BT474 cell line (D), and the MDA-MB-231 cell line (G), as the interval between two 24 hour doxorubicin exposures varies at 75 nM in the MCF7 cell line (B), at 35 nM in the BT474 cell line (E), and at 200 nM in the MDA-MB-231 cell line (H), and as the number of sequential 24 hour doxorubicin exposures varies at a two day interval and 75 nM in the MCF7 cell line (C), at a zero day interval (continuous exposure) and 35 nM in the BT474 cell line (F), and at a two day interval and 200 nM in the MDA-MB-231 cell line (I). The number of replicates in each group varies between 3 and 12; all replicates in which recovery is observed are included (see Fig 4).

