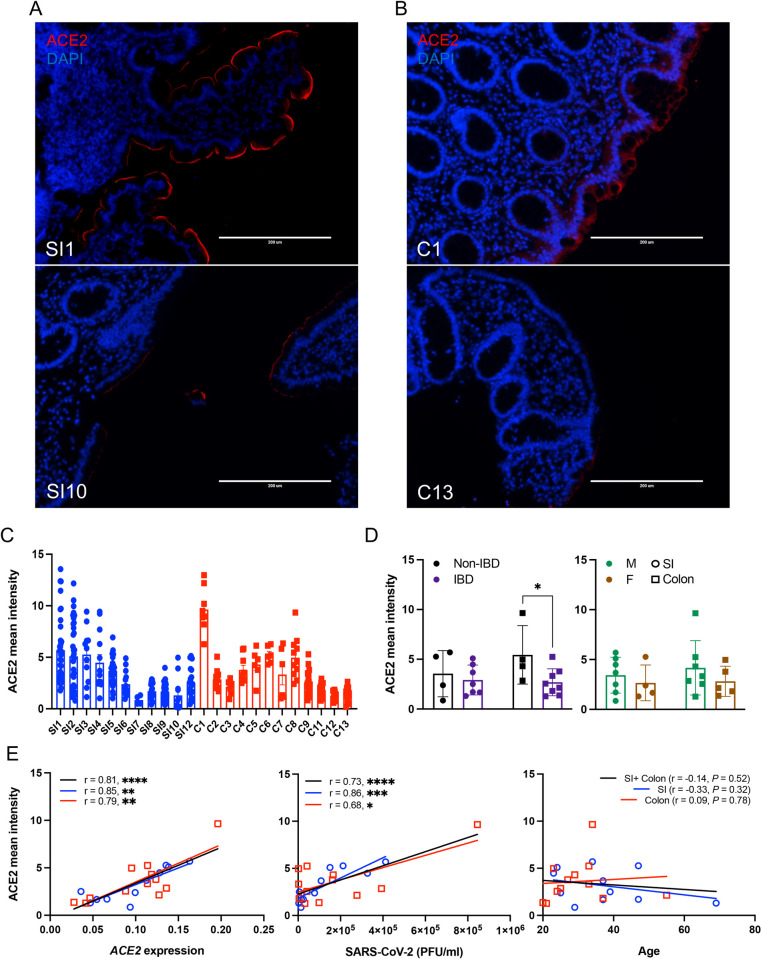
Fig 3. Differential ACE2 expression observed in individual intestinal organoid lines are conserved in primary tissue from the same donor.
(A and B) Representative ACE2 staining images in primary tissues of terminal ileum (A) and ascending colon (B) from which SI1, SI10, C1, and C13 organoids were established. (C) Mean intensity of ACE2 per area in each field of view from the primary tissues from which small intestinal and colonic organoids were established. (D) Mean intensity of ACE2 by disease (left) or sex (right). (E) Correlation of ACE2 mean intensity with ACE2 expressions (left) and SARS-CoV-2 PFU (middle) among monolayers or donor age (right). Data points in C are the field of views, and data points in D and E are mean of at least 2 technical replicates of individual organoid lines. Bars represent mean ± SEM, and at least 2 independent experiments were performed. Underlying data can be found in S1 Data. Scale bars: 200 μm. P, P value; r, Pearson correlation coefficient. *P ≤ 0.05, **P ≤ 0.01, ***P ≤ 0.001, and ****P ≤ 0.0001 by unpaired t test, 2 tailed in D and simple regression analysis in E. ACE2, angiotensin I converting enzyme 2; F, female; IBD, inflammatory bowel disease; M, male; PFU, plaque-forming unit; SARS-CoV-2, Severe Acute Respiratory Syndrome Coronavirus 2; SI, small intestine.

