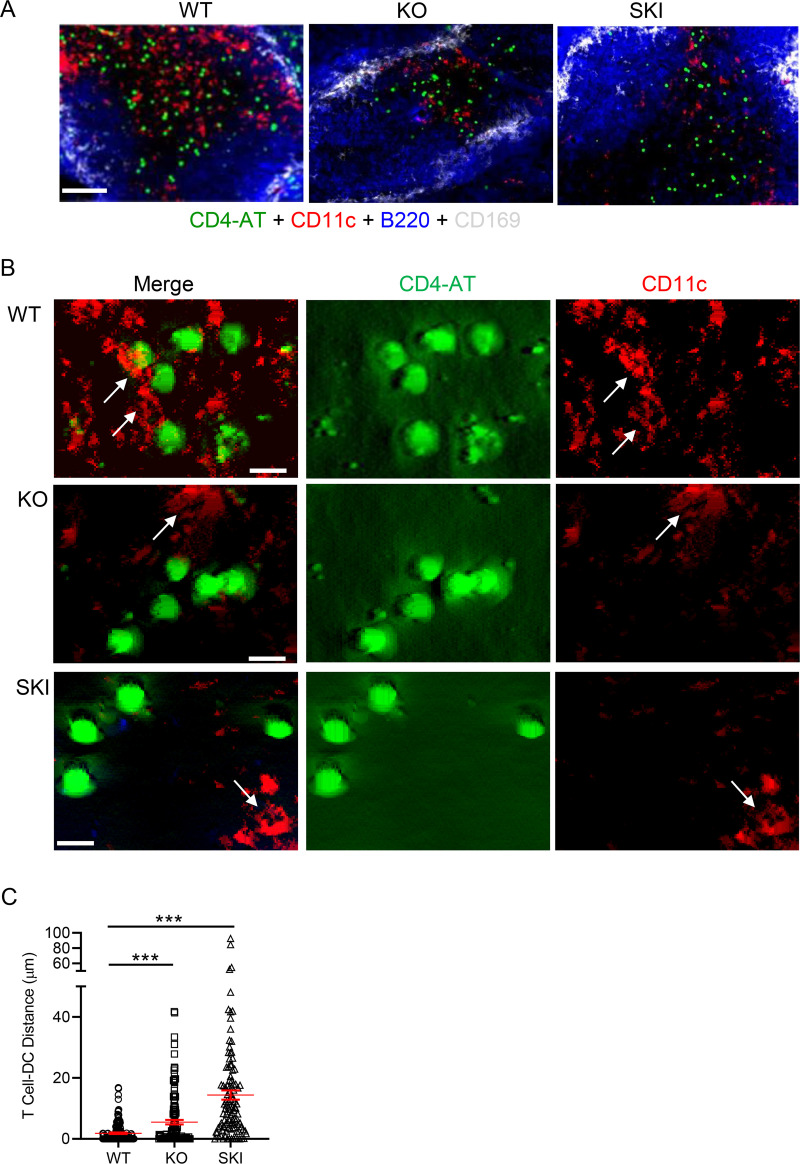
Fig 6. Reduced CD4+ OTII T cell proximity to CD11c+ DCs in Cd47KO and SKI splenic T cell zones.
(A) CFSE-labeled WT OTII T cells (4x10⁶) were i.v. injected into Cd47KO, SKI and WT recipient mice. Twenty-four hrs later, spleens were harvested and processed into frozen blocks. Four-color immunofluorescence microscopy of transferred CFSE+ OTII T cells, CD11c+, B cell follicles and CD169+ marginal zone macrophages within the splenic white pulp. Data are representative of 3–5 replicate sections from 3 mice per group. Calibration bar, 100 μm. (B) Immunofluorescence microscopy of CFSE+ T cells (green) and CD11c+ DCs (red) within T cell zone. Arrows identify CD11c+ DCs. Representative of 3 mice per group. Scale bars, (A) 25 μm and (B) 5 μm. (C) Proximity of CFSE CD4+ OTII T cells (green) to splenic CD11c+ (red) DCs in T cell zones of splenic white pulp in mice immunized with OVA protein. The number of CFSE+ T cells in T cell zone analyzed were WT, 154; Cd47KO, 135; SKI, 109. *** p < 0.0001 by one-way ANOVA with Welch’s correction.

