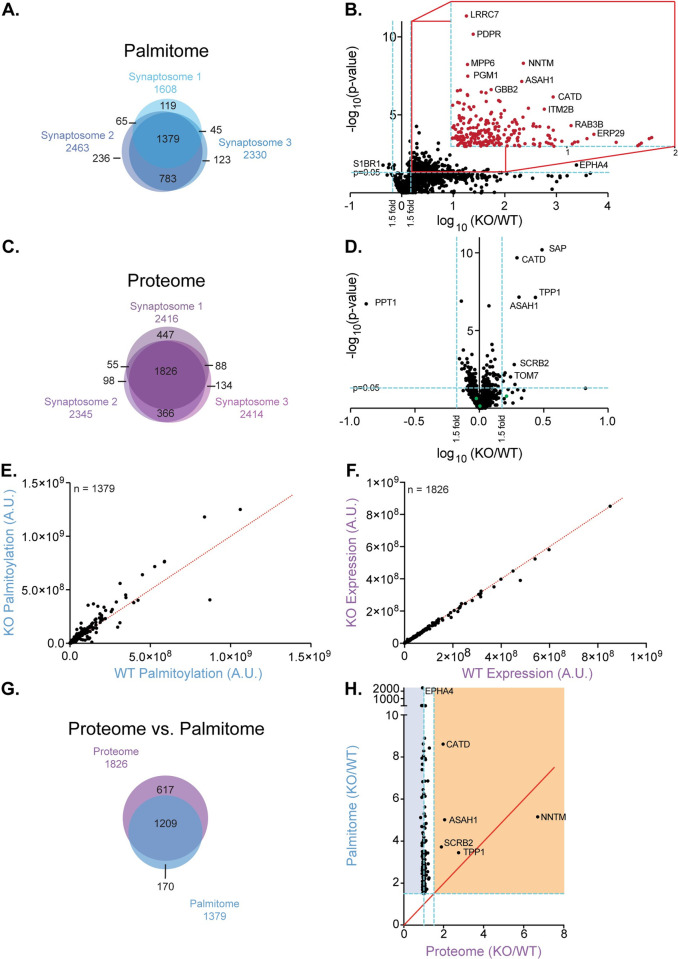
Fig 2. Putative PPT1 substrates are enriched at the synapse and display persistent palmitoylation.
(A) Venn diagram of 3 palmitome experiments exhibits 1,379 common proteins. (B) Volcano plot indicates 242 proteins are significantly differentially palmitoylated (4 decrease; 238 increase; 1.5-fold, p < 0.05; blue lines; S2 Table, S1 Data). Inset shows significantly increased proteins. The p-value was calculated using a 2-tailed t test on 3 biological and 3 technical replicates. While the technical replicates do not meet the t test condition for independence, we chose to proceed in this manner to generate more putative substrates that could later be validated with higher stringency. (C) Venn diagram of 3 independent proteome experiments exhibits 1,826 common proteins. (D) Volcano plot of fold change between genotypes (PPT1 KO/WT littermates) for proteins identified in all 3 biological replicates. A total of 11 proteins are significantly differentially expressed (1 decrease (PPT1); 10 increase; 1.5-fold, p < 0.05; blue lines; S1 Data). Other depalmitoylating enzymes (green points) do not display significant compensatory up-regulation of protein expression. (E) Palmitoylated protein expression is somewhat correlated between genotypes (R2 = 0.899; m = 1.134 ± 0.0197), with increased palmitoylation in PPT1 KO (S1 Data). (F) Protein expression is almost perfectly correlated between genotypes (R2 = 0.9966; m = 0.969 ± 0.0016; S1 Data). Red lines indicate 1:1 WT to PPT1 KO protein expression ratio. (G) Venn diagram of 1,209 common proteins between whole brain proteome and palmitome (n = 3 each). (H) Protein expression levels compared to palmitoylation levels for significantly changed proteins in palmitome. Proteins in orange region are increased (1.5-fold, p < 0.05) in both proteome and palmitome. Proteins in blue region display decreased or unchanged protein expression and increased palmitoylation. Red line indicates equal expression and palmitoylation levels (x = y). While NNTM has a high fold change, it does not meet the p-value criterion for significantly increased protein expression (p = 0.0522) and is therefore excluded from this category (S1 Data). ASAH1, Acid Ceramidase; CATD, Cathepsin D; KO, knockout; PPT1, palmitoyl protein thioesterase 1; TPP1, Tripeptidyl Peptidase 1; WT, wild-type.

