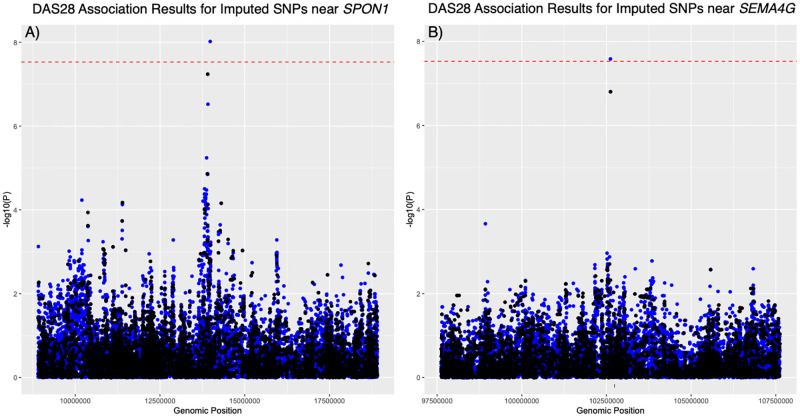
Fig 3. Fine mapping of regions with suggestive associations with DAS28 (week 12).
(A) Manhattan plot of significance scores from linear regression analysis of DAS28 for common SNPs in a 10Mb window around the SPON1 locus. (B) Manhattan plot of significance scores from linear regression analysis of DAS28 for common SNPs in a 10Mb window around the SEMA4G locus. SNPs genotyped on the Omni2.5M array are shown in black while imputed SNPs appear in blue. The dotted red line indicates the original Bonferroni threshold for significance.

