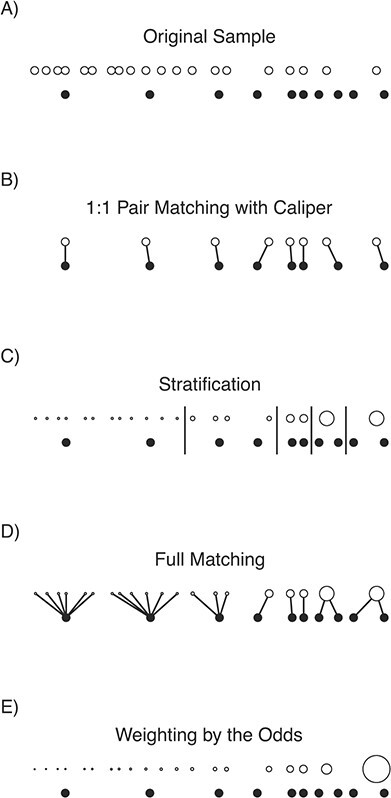
Figure 2.

A visual demonstration of matching and weighting for the average exposure effect in the exposed on a toy data set. Exposed units (filled circles) and unexposed units (unfilled circles) are aligned horizontally by their propensity score. The size of the dots corresponds to the value of the resulting matching weights for the matching methods and propensity score weights for weighting by the odds. Links between units represent pairs, and long vertical lines represent stratum boundaries. Notice that only 8 of the original 10 exposed units remain after 1:1 pair matching with a caliper, changing the estimand. In this example, the best balance and effective sample size were found with full matching and stratification; the worst balance and effective sample size were found with weighting by the odds, due to the extreme weight for the rightmost unexposed unit.
