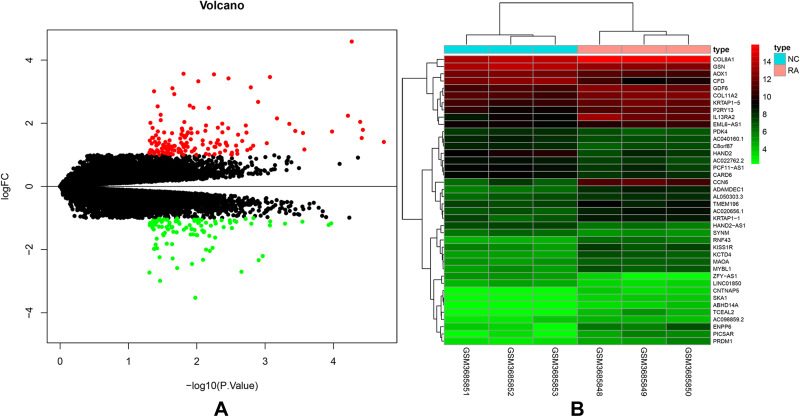
Figure 9.
Differential expression analysis of GSE128813. (A) Volcanomap, black is the genes and lncRNAs with no difference, red is the genes and lncRNAs that are up-regulated, and green is the genes and lncRNAs that are down-regulated. (B) Heatmap, the abscissa is the sample, the ordinate is the differentially expressed genes and differentially expressed lncRNAs, red is high expression, and green is low expression.

