FIGURE 6.

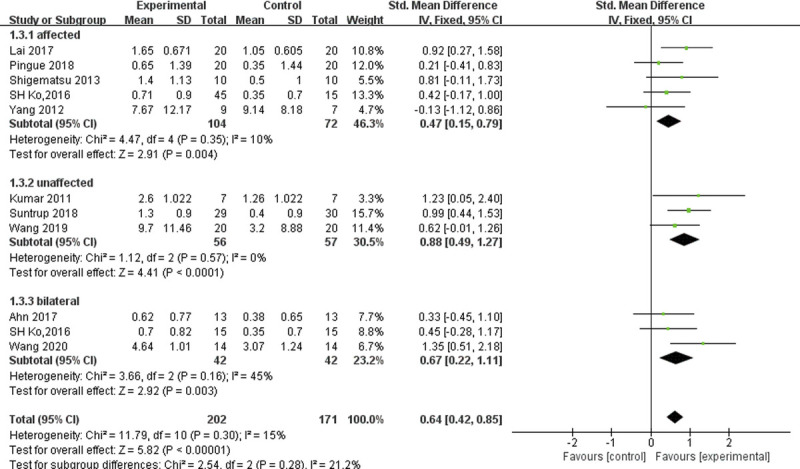
Forest plot of subgroup analysis, which shows the effect sizes for affected, unaffected, and bilateral hemisphere stimulation.

Forest plot of subgroup analysis, which shows the effect sizes for affected, unaffected, and bilateral hemisphere stimulation.