. 2022 Mar 24;11:e77610. doi: 10.7554/eLife.77610

Figure 3. Effects of simultaneous knockout of both Acvr1b and Tgfbr1 on myonuclear number and signalling for protein synthesis as well as degradation.

Figure 3.

(A) No differences in myonuclear lengths were observed in longitudinal sections of TA type IIB myofibres of Acvr1b:Tgfbr1 CKO compared to control animals. This indicates that simultaneous knockout of Acvr1b:Tgfbr1 CKO did not affect the number of myonuclei per myofibre and that the myonuclear domain (i.e. cross-sectional area/ nuclei (μm2)) was almost doubled. Scale bar = 100 μm. (B) Western blot analysis for Smad2/3 phosphorylation in TA and EDL muscle. (C) Relative gene expression of growth factors in non-injured muscle. (D) Western blot analysis of phosphorylated and total Akt and p70S6K in TA muscles. Results are presented as mean + SEM. N = 5–8 mice. *: p < 0.05. Significant differences between individual groups are indicated by lines with a *. Single * indicates significant difference compared to all other groups at the same time point.

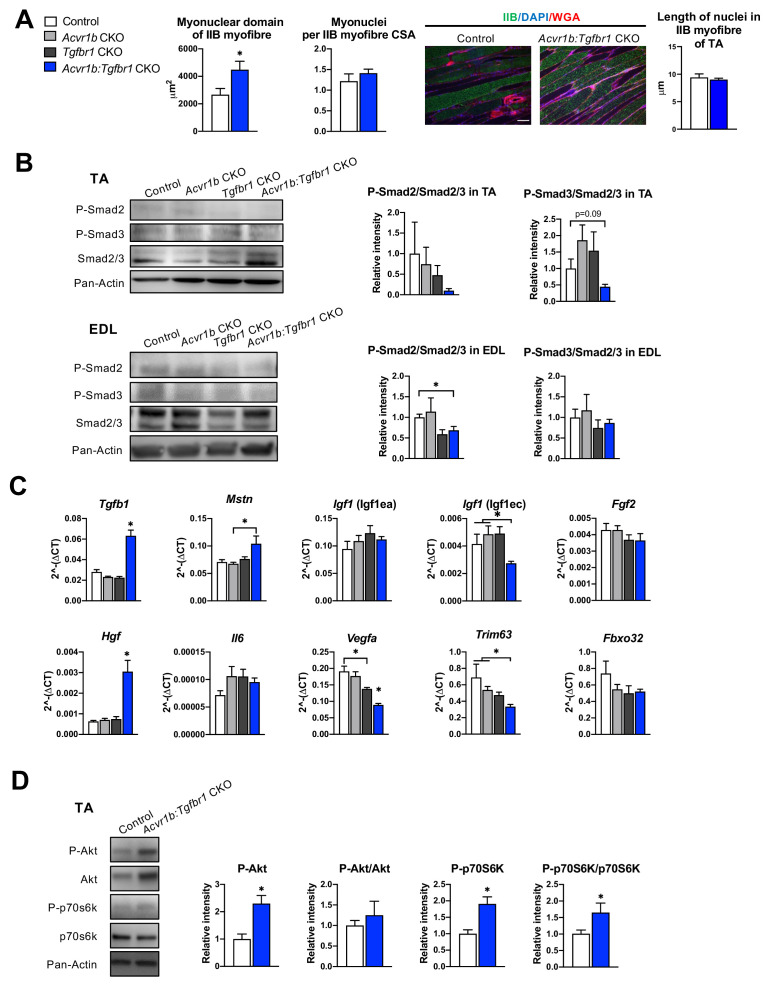
Figure 3—source data 1. Quantification of myonuclear domain, qPCR of growth factors and Western blot of P-Smad2/3, Smad2/3, P-Akt, Akt, P-p70s6k, and p70s6k in absence of injury.
Figure 3—source data 2. Raw Western blot image of (A) P-Smad2, (C) P-Smad3 and (E) Smad2/3, (G) pan-Actin.
Labelled images of (B) P-Smad2, (D) P-Smad3 and (F) Smad2/3 and (H) pan-Actin of tibialis anterior (TA) muscle in groups of control (con), Acvr1b CKO (A), Tgfbr1 CKO (T) and Acvr1b: Tgfbr1 CKO (dKO).
Figure 3—source data 3. Raw Western blot image of (A) P-Smad2, (C) P-Smad3, and (E) Smad2/3, (G) pan-Actin.
Labelled images of (B) P-Smad2, (D) P-Smad3, and (F) Smad2/3 and (H) pan-Actin of extensor digitorum longus muscle (EDL) in groups of control (con), Acvr1b CKO (A), Tgfbr1 CKO (T), Acvr1b: Tgfbr1 CKO (dKO) and positive control sample (pos).
Figure 3—source data 4. Raw Western Blot image of (A) P-AKT, (C) AKT and (E) P-p70s6k, (G) p70s6k and (I) pan-Actin.
Labelled images of (B) P-AKT, (D) AKT and (F) P-p70s6k, (H) p70s6k and (I) pan-Actin of TA in groups of control (con), Acvr1b: Tgfbr1 CKO (dKO) and positive control sample (pos).