. 2022 Mar 24;11:e77610. doi: 10.7554/eLife.77610

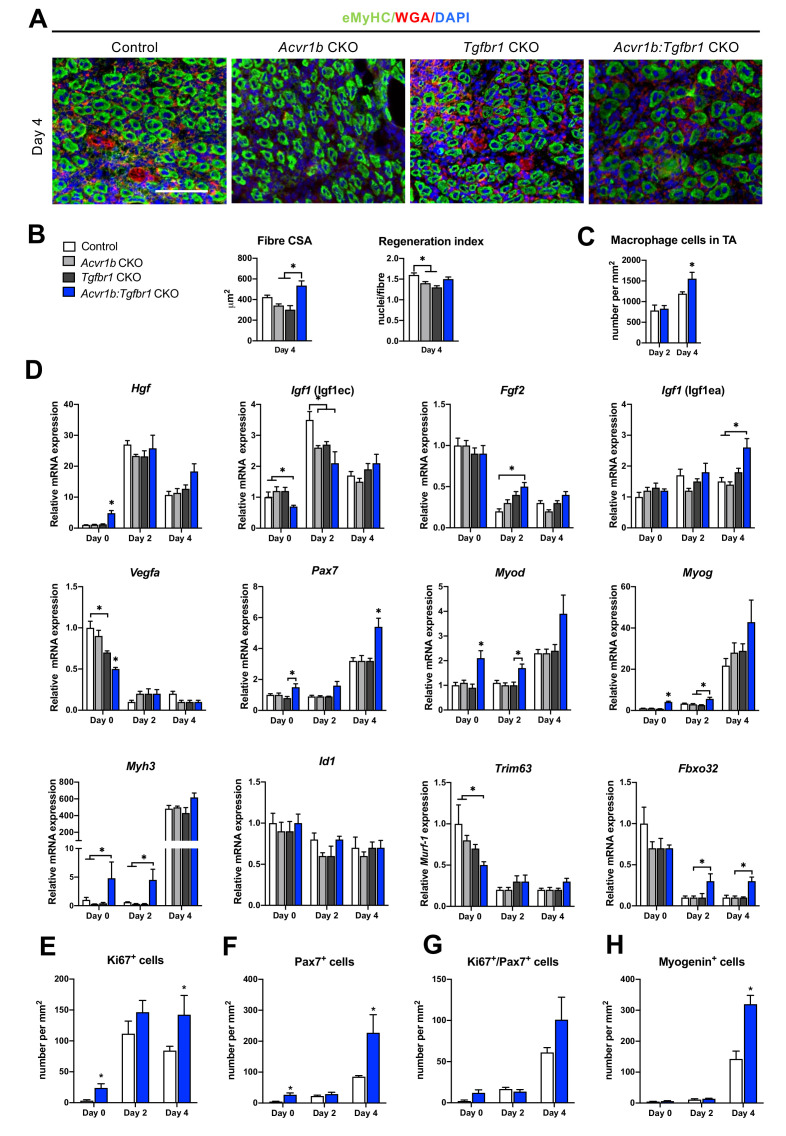
Figure 5. Acvr1b:Tgfbr1 CKO mice showed enhanced CSA of regenerating myofibres and early enhanced expression of myogenic genes and differentiating cells after acute injury.

(A) IF staining images represent eMyHC+ myofibres 4 days after CTX injection. Scale bar = 100 μm. (B) CSA of eMyHC+ myofibres in injured area increased in Acvr1b:Tgfbr1 CKO mice compared to Acvr1b CKO and Tgfbr1 CKO animals, while RI was decreased in both Acvr1b CKO and Tgfbr1 CKO mice compared to controls. (C) Number of macrophages was quantified in the injured area. (D) Relative gene expression in TA in absence (day 0) or presence of CTX injection after 2 and 4 days are presented. Increased number of Ki67+ cells (E) and Pax7+ (F) cells were found in TA of Acvr1b:Tgfbr1 CKO mice in absence of injury as well as 4 days after CTX injection. (G) Four days post injury, number of Ki67+/Pax7+ cells was not different between control and Acvr1b:Tgfbr1 CKO mice. (H) More Myogenin+ cells were found in injured area of Acvr1b:Tgfbr1 CKO mice on day 4 post injury. Results are presented as mean + SEM. N = 5–8 mice, *: p < 0.05. Significant differences between individual groups are indicated by lines with a *. Single * indicates significant difference compared to all other groups at the same time point.

Figure 5—source data 1. Quantification of regenerating myoblasts upon acute injury, qPCR results and number of myogenic committed cells in TA at day 0,2 and 4.
elife-77610-fig5-data1.xlsx (121.5KB, xlsx)

Figure 5.

Figure 5—figure supplement 1. Number of macrophages in TA of Acvr1b:Tgfbr1 CKO animals was increased 4 days post injury.
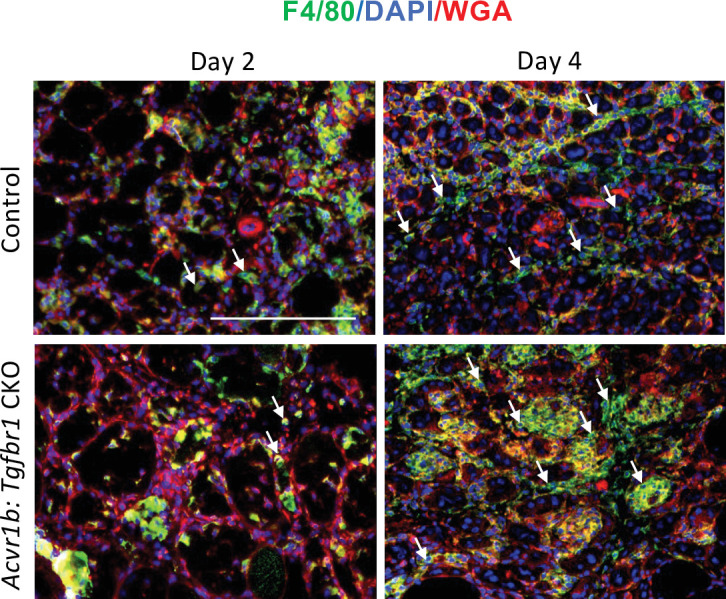
Figure 5—figure supplement 1.

Number of macrophages (F4/80+, green) in control and Acvr1b:Tgfbr1 CKO animals on days 2 and 4 post injury. Nuclei were stained by DAPI (blue) and ECM of muscle were stained by WGA (red). Scale bar = 100 μm. N = 5–7.
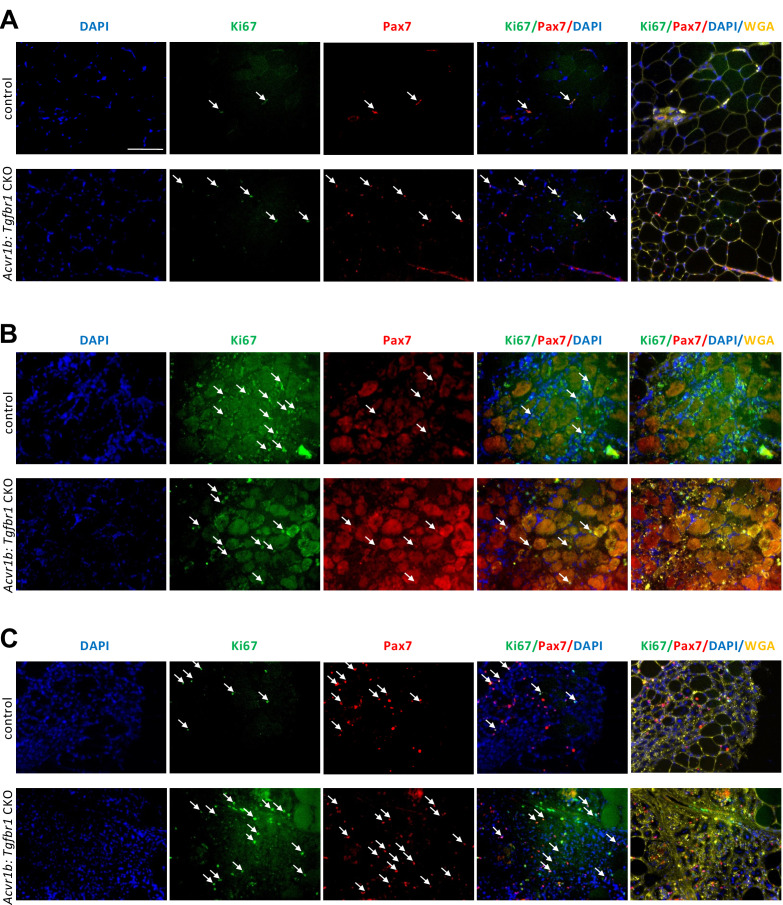
Figure 5—figure supplement 2. Increased number of proliferating cells and satellite cells in TA of Acvr1b:Tgfbr1 CKO animals in absence of injury and 4 days post injury.

Figure 5—figure supplement 2.

(A) In absence of injury, proliferating cells (Ki67+, green, white arrows) and muscle satellite cells (Pax7+, red, white arrows) were shown by IF staining in low oxidative area of TA, where regeneration patches were found. Two (B) and 4 (C) days post injury, more Ki67+ and Pax7+ cells (white arrows) infiltrated in injured area. Nuclei were stained by DAPI (blue) and ECM of muscle were stained by WGA (yellow). Scale bar = 100 μm. N = 5–7.
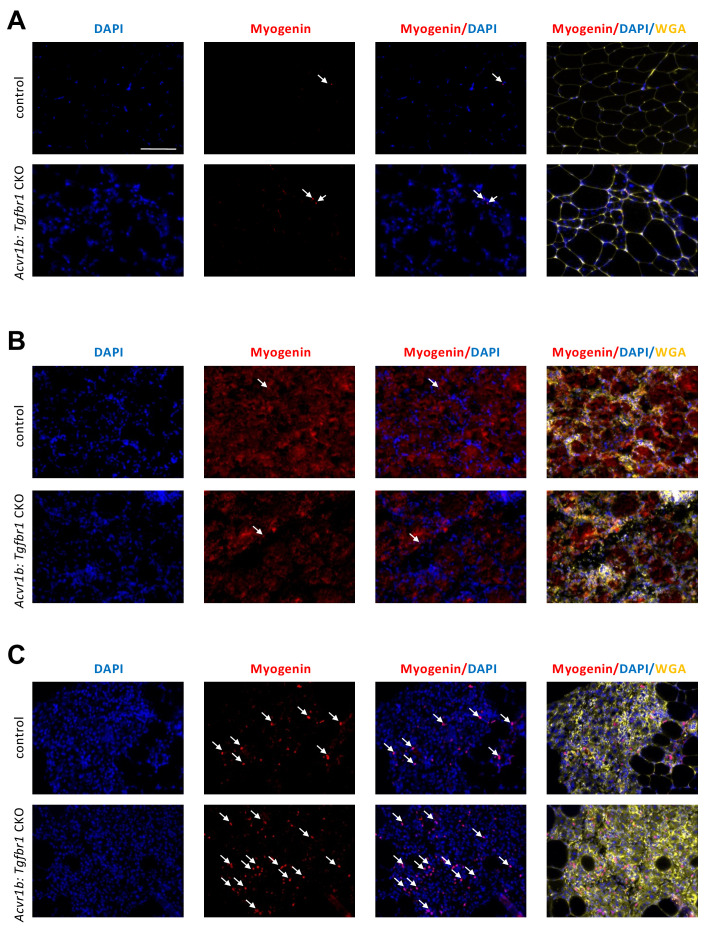
Figure 5—figure supplement 3. Increased number of differentiating muscle cells in TA of Acvr1b:Tgfbr1 CKO animals 4 days post injury.

Figure 5—figure supplement 3.

On day 0 (A) and 2 days (B) post injury, the number of differentiating myoblasts (myogenin+, red, white arrows) was of no difference between groups. Four days (C) post injury, more Myogenin+ cells were found in injured area of Acvr1b:Tgfbr1 CKO animals. Nuclei were stained by DAPI (blue) and ECM of muscle were stained by WGA (yellow). Scale bar = 100 μm. N = 5–7.