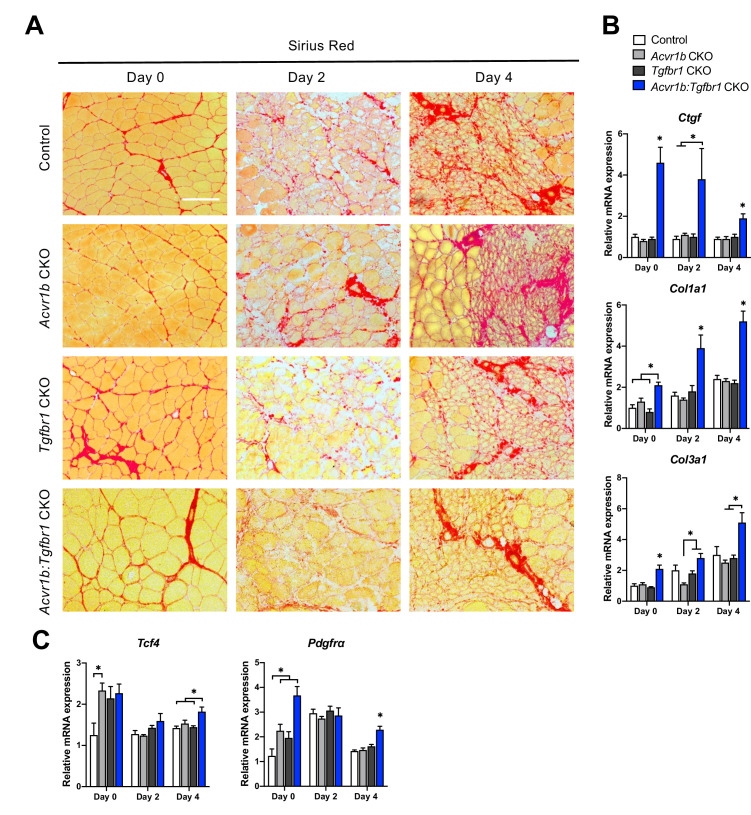
Figure 6. Relative mRNA expression levels of ECM components were enhanced in Acvr1b:Tgfbr1 CKO mice.
(A) Sirius Red staining shows collagen deposition in absence (day 0) or presence of CTX injection after 2, and 4 days (scale bar = 100 μm). (B, C) Relative gene expression in TA muscle in absence (day 0) or presence of CTX injection after 2 and 4 days. Results are presented as mean + SEM. N = 5–8 mice, *: p < 0.05. Significant differences between individual groups are indicated by lines with a *. Single * indicates significant difference compared to all other groups at the same time point.

