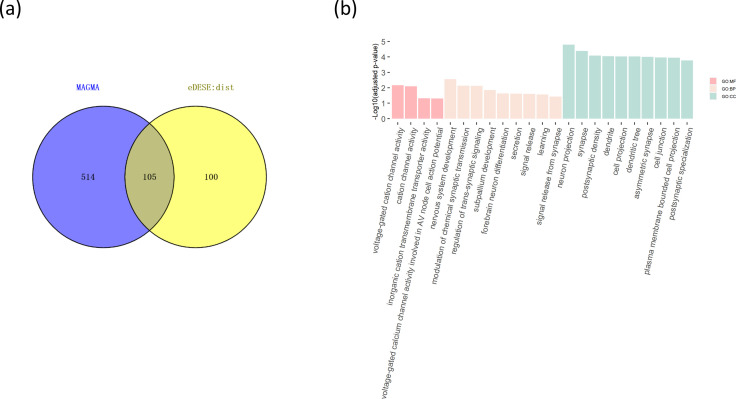
Figure 6. The comparison of the potential susceptibility genes for schizophrenia identified by MAGMA and eDESE:dist.
(a) The Venn diagram shows the overlapped and unique genes identified by MAGMA and eDESE:dist. (b) The bar plot shows the top GO enrichment terms of the overlapped genes. MF: Molecular Function of GO. BP: Biological Process terms of GO. CC: Cellular Component terms of GO. The x-axis label represents the top ( ≤ 10) significant GO enrichment terms (MF, BP, and CC). The y-axis label represents the negative log10 of the adjusted p-value of each term. See also Figure 6—source data 1, Figure 6—source data 2 and Figure 6—source data 3.

