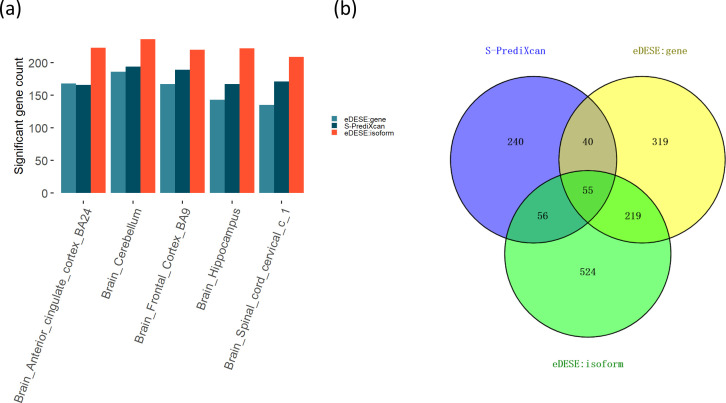
Figure 7. Comparison of the potential susceptibility genes identified by S-PrediXcan, eDESE:gene, and eDESE:isoform.
(a) The bar plot shows the count of potential susceptibility genes in each of the five optimized brain regions. (b) The Venn diagram shows the count of the overlapped and unique genes identified by S-PrediXcan, eDESE:gene and eDESE:isoform in the five optimized brain regions. See also Figure 7—source data 1 and Figure 7—source data 2.

