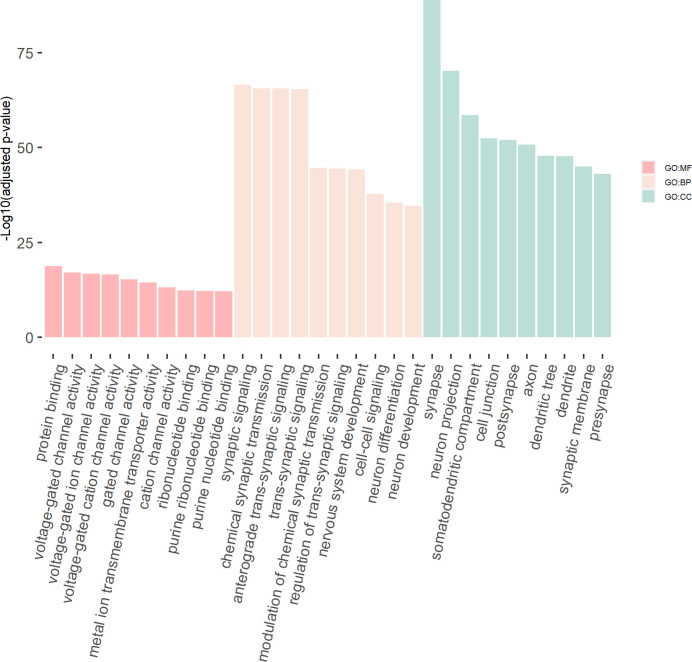
Figure 8. The GO enrichment terms of the genes in the consensus module (colored ‘turquoise’).
The x-axis label represents the top (≤10) significant GO enrichment terms (in MF, BP, and CC). The y-axis label represents the negative log10 of the adjusted p-value of each term. See also Figure 8—source data 1 and Figure 8—source data 2.

