. 2022 Mar 21;11:e72555. doi: 10.7554/eLife.72555

Figure 1. Solution and crystallographic structures of leukotoxin LukE.

(A) The crystal structures of LukE in P212121 (Apo 1, green) and I4 (Apo 2, cyan) space groups are shown in cartoon representation and overlaid onto the previously published crystal structure of LukE (magenta), also in I4 space group (PDB code 3ROH). (B) Optimized ensemble of 10 models corresponding to the fitted SAXS profile in C. The N-terminal extension belonging to the signal peptide and the C-terminal polyhistidine tag are shown in orange and black, respectively. The CAP, RIM, and STEM domains are colored in cyan, deep blue and light blue, respectively. Other regions of interest are also indicated such as the D-region, and divergent loops 1–4. (C) Small angle x-ray scattering (SAXS) profiles of LukE measured at 1, 2, and 4 mg/ml are shown as black, red and green lines, respectively. The merged SAXS curve is shown as a brown line with the fitting curve obtained using the ensemble optimization method (EOM) in orange. (D) Radius of gyration distributions for the initial pool ensemble (gray area and black line) and for the optimized ensembles (red bars) obtained using the merged SAXS curve.

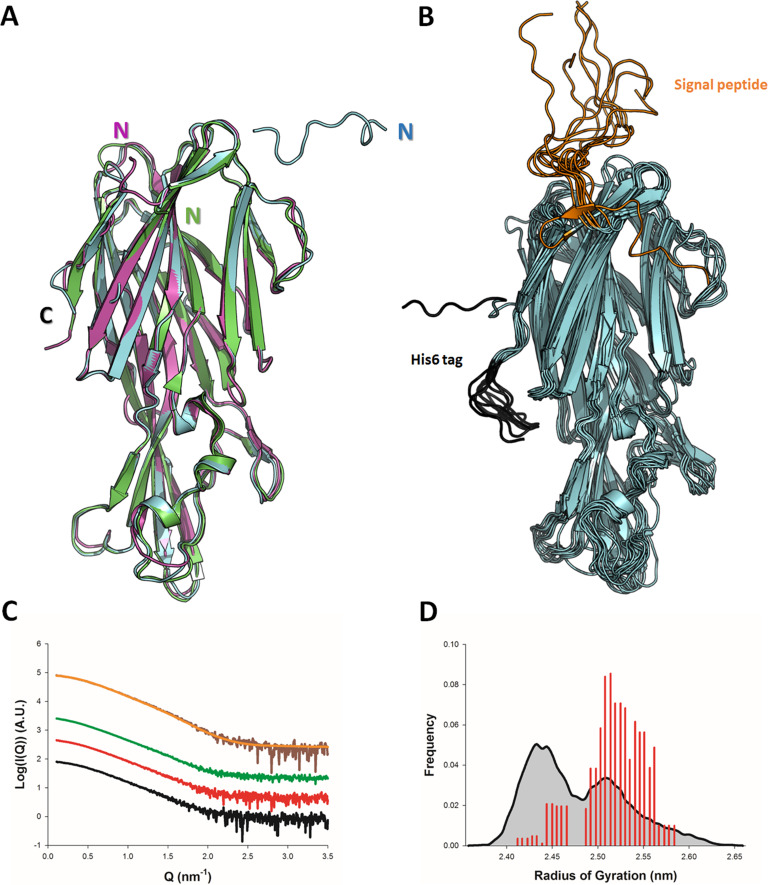
Figure 1.

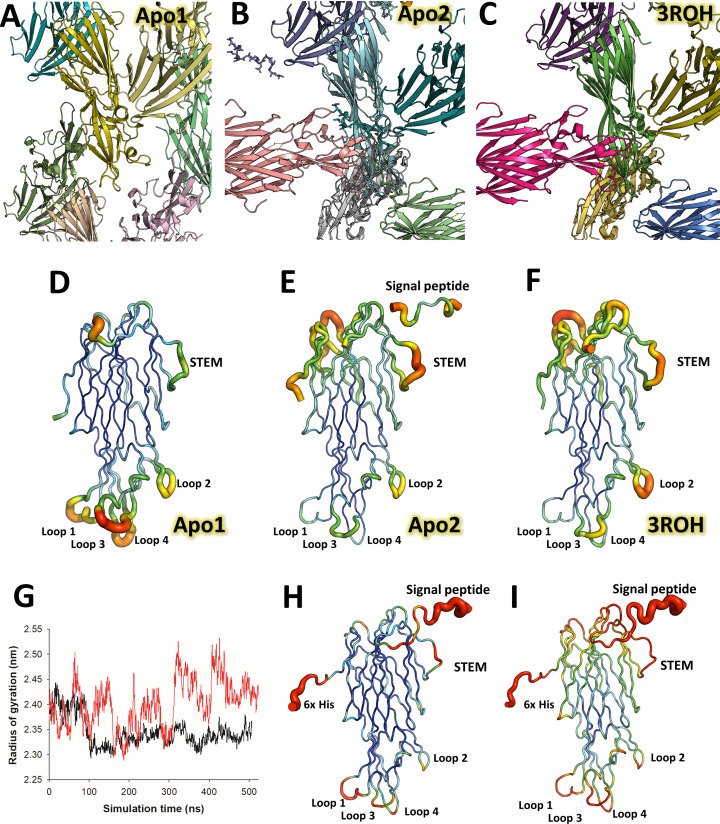
Figure 1—figure supplement 1. Crystallographic packing differences between LukE structures, LukE flexibility in crystal structures and molecular dynamics simulations.

Figure 1—figure supplement 1.

(A–C) Crystallographic packing differences between LukE apo 1 structure in P212121 space group (A), apo 2 (B) and the previously published structure (C) (PDB code: 3ROH), both in I4 space group. (D–F) B-factor putty representation of the apo 1, apo 2, and 3ROH crystal structures, highlighting the flexibility of the stem loop and the divergent region (DR) loops within the rim domain, as well as the influence of crystal packing on the flexible regions. (G–I) Molecular dynamics simulations data of LukE. (G) Radius of gyration (Rg) over time is shown for two independent molecular dynamics (MD) trajectories performed with the amber99sb-ildn (black line) or amber99sbw (red line). The amber99sbw force field was parameterized with rescaled water-protein interactions to improve the sampling of intrinsically disordered regions (reference), avoiding the collapse of LukE N-terminal signal peptide and C-terminal polyhistidine tag onto the protein core. (H and I) B-factor putty representation of the root mean square fluctuations of LukE extracted from the amber99sb-ildn (H) or amber99sbw (I) trajectories.
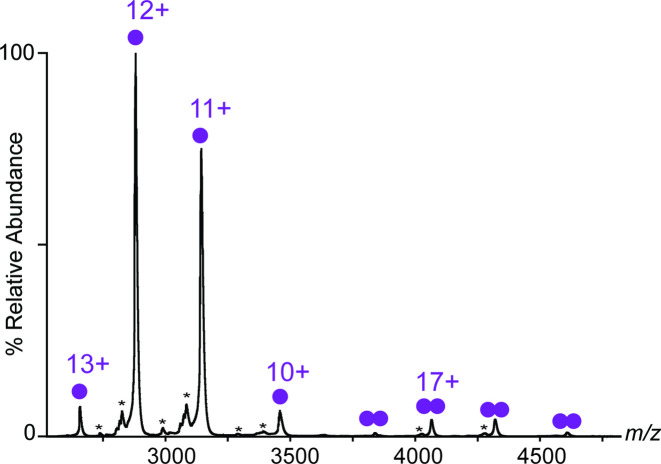
Figure 1—figure supplement 2. Native MS spectrum of LukE.

Figure 1—figure supplement 2.

nMS spectrum of 20 µM LukE showing the presence of both monomeric species (single purple circle) at 34,508 ± 4 Da and dimeric species (double purple circle) at 69,108 ± 8 Da. Theoretical mass of LukE is 34,506 Da. hydrolysed isoforms of lukE are also visible at low intensities (asterisks).