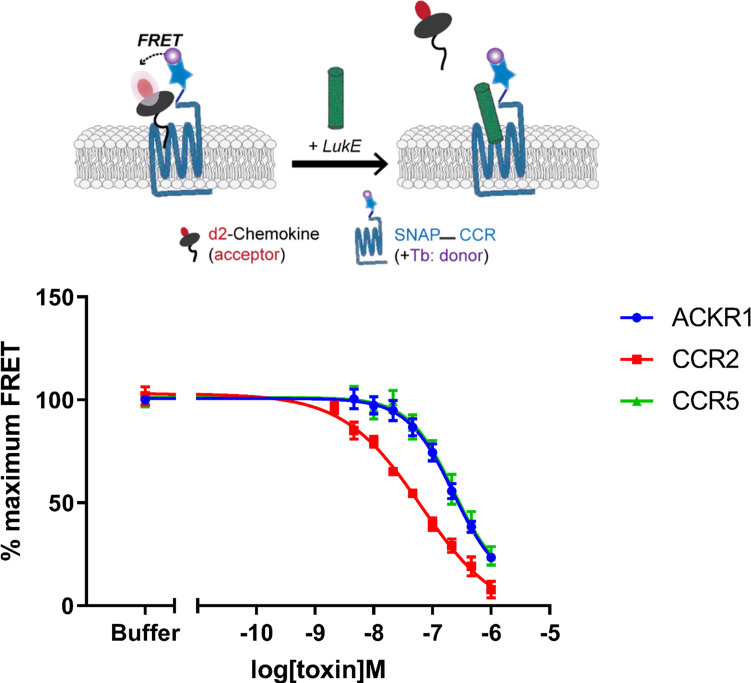
Figure 2. Binding of LukE in live cells as determined by competition time-resolved fluorescence energy transfer (TR-FRET).
The upper panel shows a schematic of the competitive TR-FRET assay. Addition of toxins disrupts energy transfer between a SNAP-tagged receptor labeled with a Terbium donor and a d2-chemokine acceptor (Zwier et al., 2010). The bottom panel shows the competition dose-response curves at receptors CCR5, ACKR1, and CCR2. 5 nM tracer ligands, CCL5-d2 for CCR5 and ACKR1 and CCL2-d2 for CCR2 were used to determine TR-FRET at their respective receptors in the presence of LukE. IC50 values are quoted in-text. Data shown is mean ± SEM of three independent experiments performed in triplicate.

