. 2022 Mar 21;11:e72555. doi: 10.7554/eLife.72555

Figure 3. Crystal structure of LukE in complex with p-cresyl sulfate.

(A) Overview of the asymmetric unit of the crystal. Protein is shown in cartoon representation and colored magenta. The p-cresol sulfate molecules are shown in yellow sticks with surrounding protein residue sidechains in magenta lines (B–D). Close ups of the sulfotyrosine binding sites. The color code is the same as in (A) with p-cresol sulfate molecules and protein sidechains shown in sticks. Polar contacts between ligand and protein are shown as yellow dashed lines. In (D), protein residues from an interacting symmetry related molecule are shown in gray cartoon and sticks.

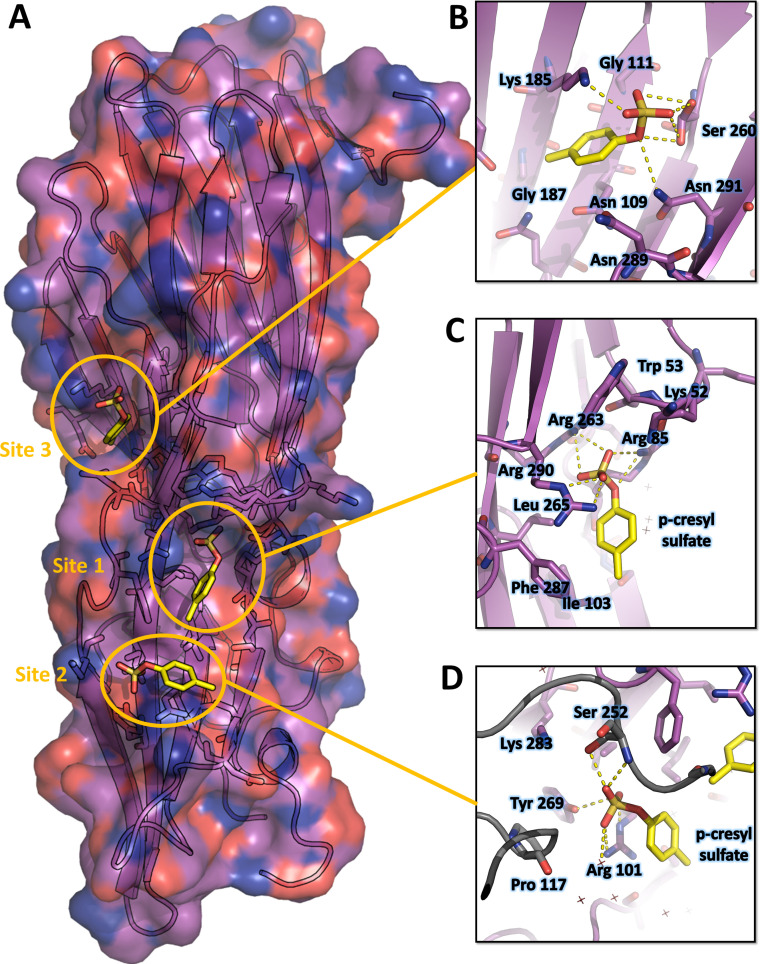
Figure 3.

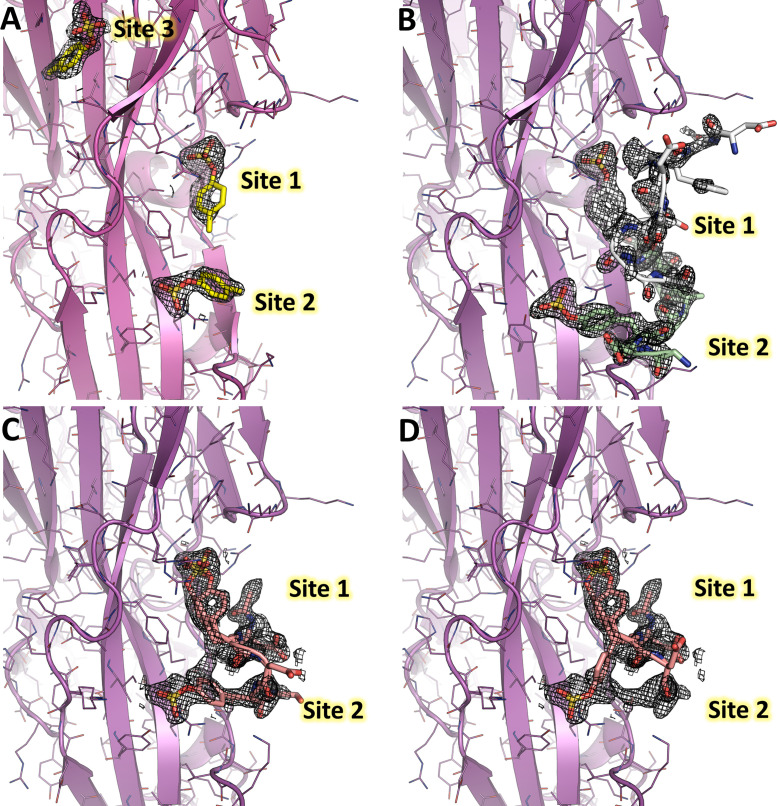
Figure 3—figure supplement 1. 2Fo-Fc electron density maps of LukE complexes overlaid with the corresponding models.

Figure 3—figure supplement 1.

For each structure, the model is shown in cartoon representation with a color code similar to Figures 3 and 4 and Figure 5. The electron density maps are shown as mesh and contoured at 1.2σ. (A) 2Fo-Fc map for the p-cresol sulfate-soaked structure. (B) 2Fo-Fc map for the ACKR1 34DSFPDGDsYGANLE46 -soaked structure (C). 2Fo-Fc map for the CCR2 25DsYDsYG29 -soaked structure, corresponding to the conformation that was deposited in the PDB. D. Same as in C, but the model was modified to show a third possible alternate conformation of sTyr26, suggesting the peptide is in equilibrium between different bound conformations.
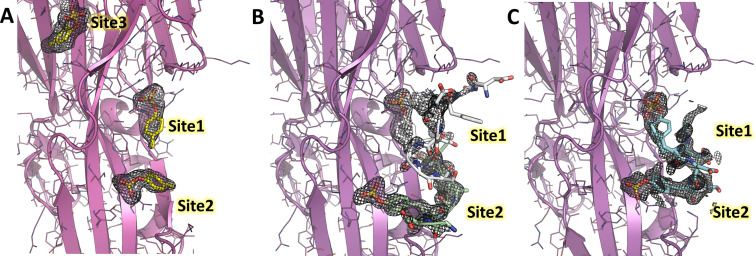
Figure 3—figure supplement 2. Polder omit maps of LukE complexes overlaid with the corresponding models.

Figure 3—figure supplement 2.

For each structure, the model is shown in cartoon representation with a color code similar to Figures 3 and 4 and Figure 5. The Polder maps for the soaked ligands are shown as mesh and contoured at 2.5σ for the p-cresol sulfate (A), ACKR1 34DSFPDGDsYGANLE46 (B) and CCR2 25DsYDsYG29 (C) soaked structures.