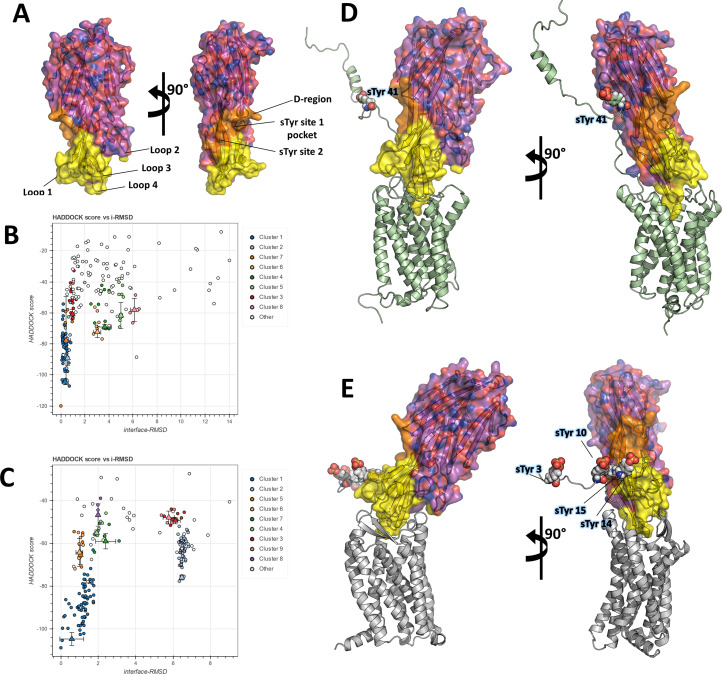
Figure 5. Computational docking of ACKR1-LukE and CCR5-LukE.
(A) Mapping of the LukE residues potentially involved in receptor binding. LukE is shown in semi-transparent surface and cartoon representation and colored in magenta. Site 1 and 2 sulfotyrosine binding sites are colored in orange. Other residues that are potentially involved in receptor binding are colored in yellow based on previous mutagenesis work (Nariya and Kamio, 1997; Reyes-Robles et al., 2013; Tam et al., 2016; Peng et al., 2018; Vasquez et al., 2020). (B) and (C). HADDOCK score versus interface root mean square deviations (iRMSD- relative to the best scoring model) plots for the best ACKR1-LukE (B) and CCR5-LukE (C) docking runs. The best cluster identified by HADDOCK (cluster 1) is shown in blue. (D) and (E). ACKR1-LukE (D) and CCR5-LukE (E) top scoring models selected from HADDOCK simulations, after addition of the missing N-terminal region (residues 8–50 of ACKR1 and residues 1–19 of CCR5), energy minimization and MD equilibration. The receptor is shown in cartoon representation and colored in pale green (ACKR1) or light gray (CCR5). Sulfated tyrosines are shown as spheres.

