. 2022 Mar 21;11:e72555. doi: 10.7554/eLife.72555

Figure 6. Computational model of the ACKR1-LukE complex extracted from molecular dynamics (MD) simulations.

(A) Superimposed MD snapshots extracted from the last 300 ns of simulation (three snapshots taken at 100 ns interval). The receptor and toxin are shown in cartoon representation and colored in pale green and magenta, respectively. ACKR1 sTyr 41 is shown as spheres. (B, C and D). Close ups of the interactions observed in the proposed model at the sulfotyrosine binding site 1 (B), sulfotyrosine binding site 2 (C), and the orthosteric pocket (D). The MD model of ACKR1-LukE corresponds to the middle structure of the largest cluster in the MD trajectory. Interacting residues are displayed as sticks. The color code is the same as in (A).

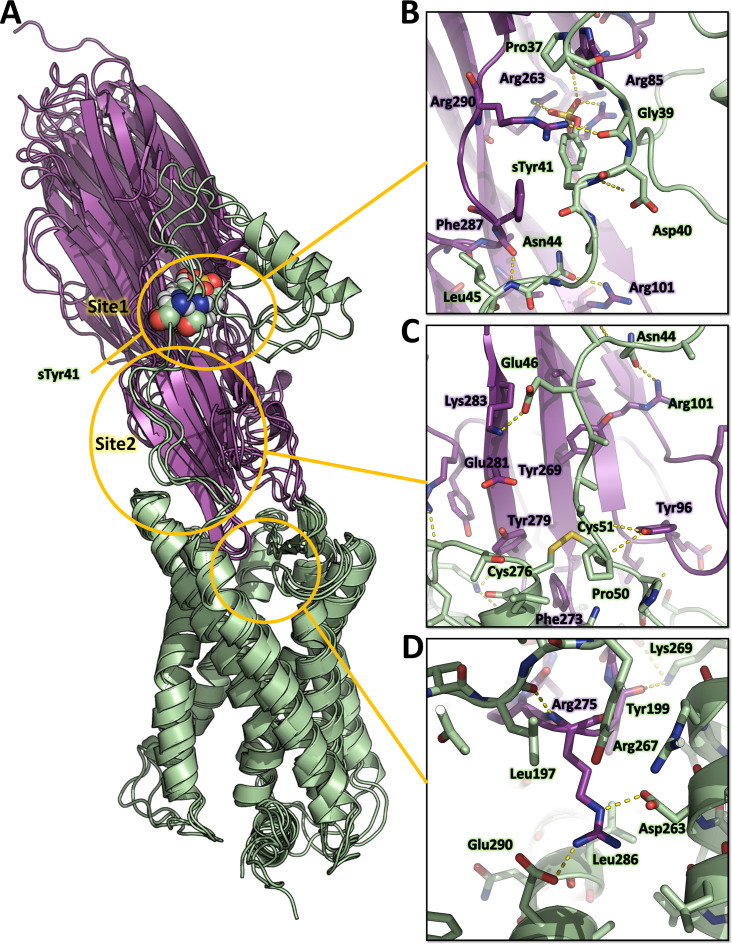
Figure 6—source data 1. PDB file of the ACKR1-LukE MD model corresponding to the middle structure of the largest cluster in the MD trajectory.

Figure 6.

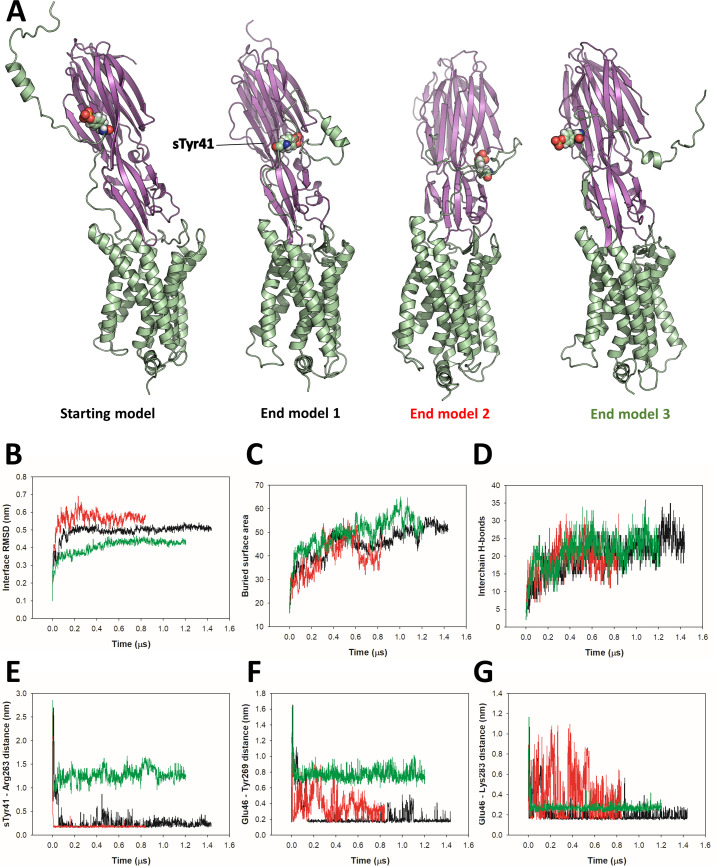
Figure 6—figure supplement 1. Analysis of ACKR1-LukE molecular dynamics (MD) simulations.

Figure 6—figure supplement 1.

(A) Starting model and end model snapshots for each of the three independent CCR5-LukE MD trajectories. (B–G) Time-dependent properties of the system extracted from MD simulations for trajectories 1, 2, and 3 (black, red, and green lines, respectively): RMSD of the interface residues relative to the starting model (B), buried surface area in the complex (C), number of interchain hydrogen bonds (D), sTyr41-Arg263 minimum distance (E), and Glu46-Tyr269 minimum distance (F). Interface residues for interface root mean square deviations (iRMSD) calculation were defined based on the starting structure using a 1 nm cutoff, and calculation was performed on Cα atoms.
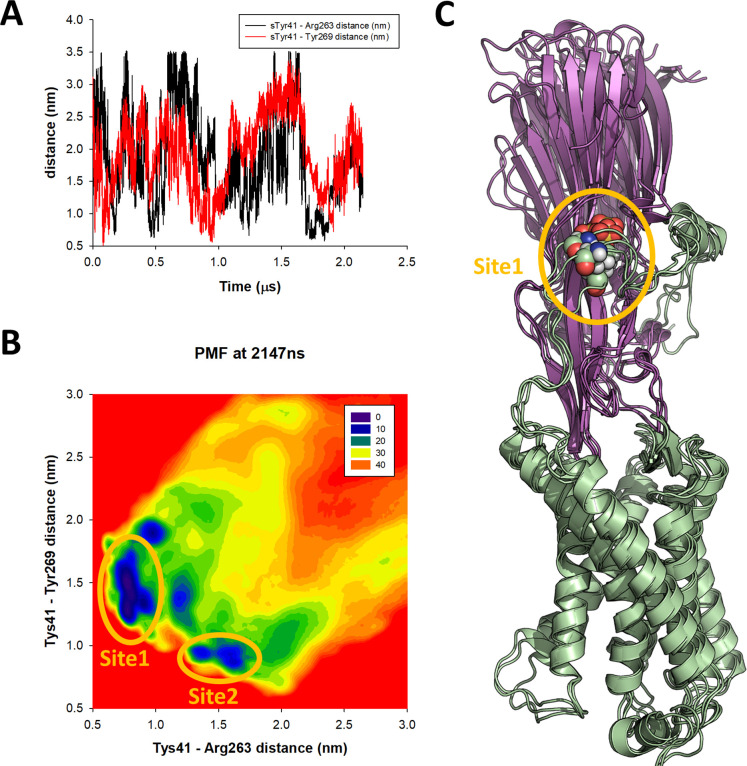
Figure 6—figure supplement 2. accelerated weight histogram (AWH) molecular dynamics (MD) simulation of the ACKR1-LukE model.

Figure 6—figure supplement 2.

(A) sTyr 41–Arg263 (site 1 – black line) and sTyr41–Tyr269 (site 2 – red line) center of mass (COM) distance as a function of simulation time, highlighting the extensive sampling of these variables during the AWH simulation. (B) Final potential of mean force (PMF) profile calculated at t = 2.147 µs. The heat map represents free energies in kJ/mol. The energy wells corresponding to site 1 and site 2 interactions are circled in orange. (C) Three snapshots extracted from the AWH MD simulation at t = 1.730, 1.740, and 1.750 µs are superimposed, which sample the global energy minimum of the PMF.
Figure 6—video 1. Time evolution of the ACKR1-LukE model conformation and estimated PMF during AWH MD.
Download video file (4.2MB, mp4)
The movie contains 215 frames from t = 0 to t = 2.14 µs (with a 10 ns timestep). Note the sampling of “site 1” free energy basin around t = 170 ns, t = 450–470 ns, and t = 1700–1900 ns.