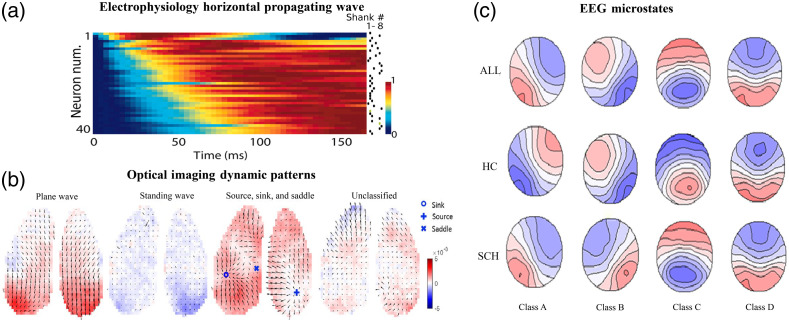
Fig. 1.
(a) Pseudocolor plot showing the normalized activity of a simultaneously recorded population triggered by “up” state onset, arranged vertically by latency. The dots indicate from which shank the neurons were recorded. Reprinted from Ref. 12 Copyright 2007 National Academy of Sciences. (b) Classification and detection of specific wave patterns at the cortex-wide scale. Reprinted from Ref. 15. (c) Spatial configuration of four microstate classes. SCH, individual with schizophrenia; HC, healthy controls; All, all participants in the study. Note how topographies extend over wide-scale areas representing global brain electrical events. Reprinted from Ref. 36.

