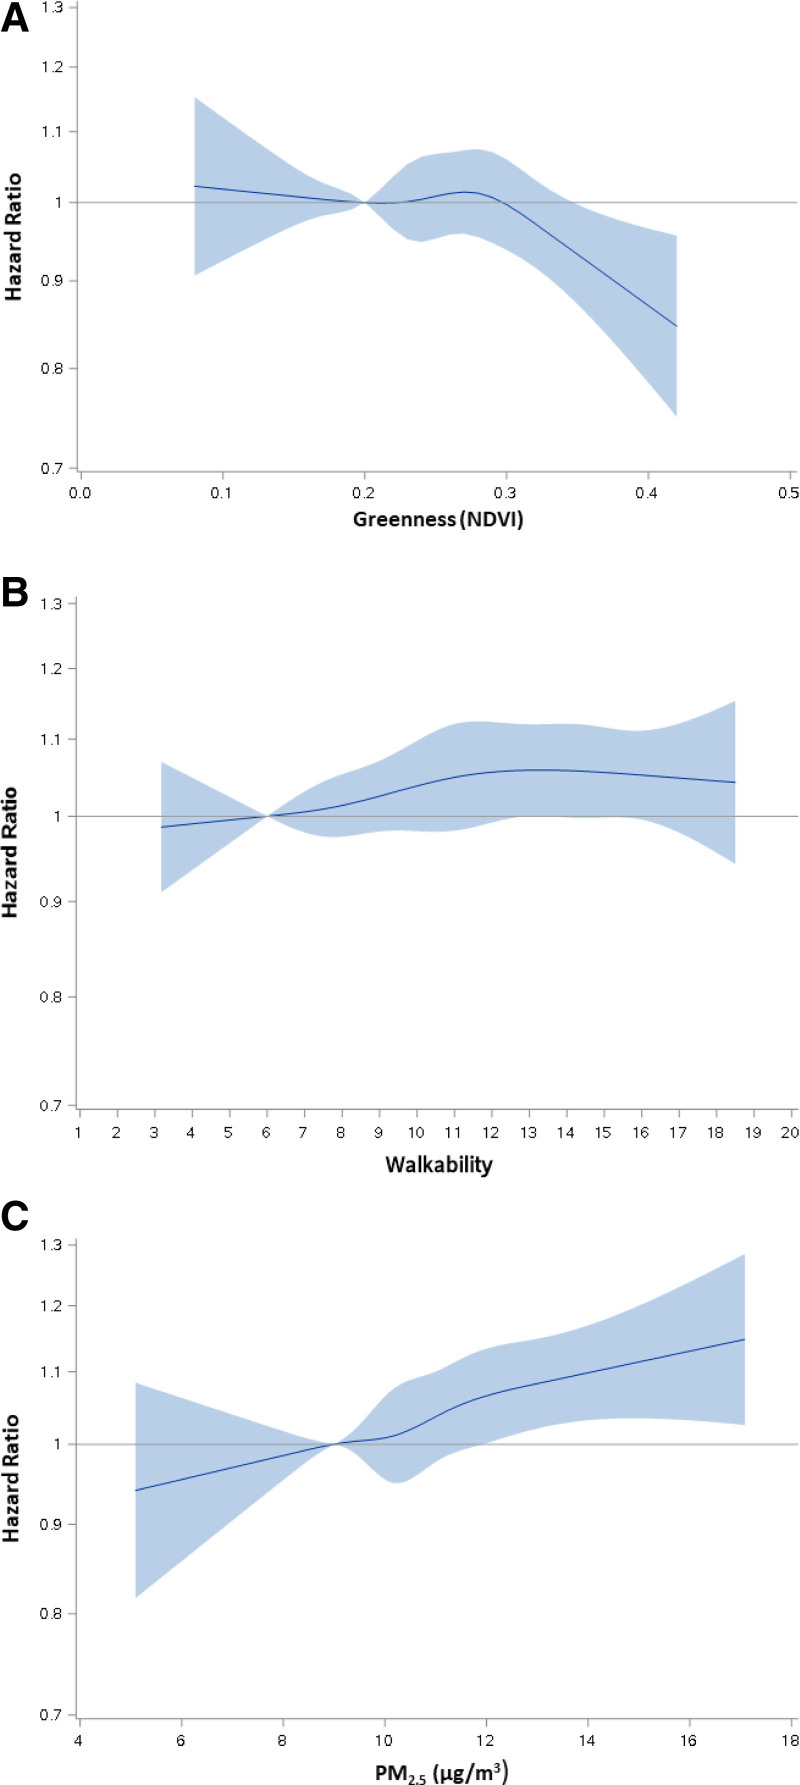
Figure 1.
Independent associations of greenness, walkability, and PM2.5with CVD mortality using restricted cubic splines. (A) greenness (N = 83,408), (B) walkability (N = 83,560), and (C) PM2.5 (N = 83,560), in models adjusted for age, sex, study start year, race, comorbidities, BMI, smoking, CVD history, revascularization, medication use, and SES.

