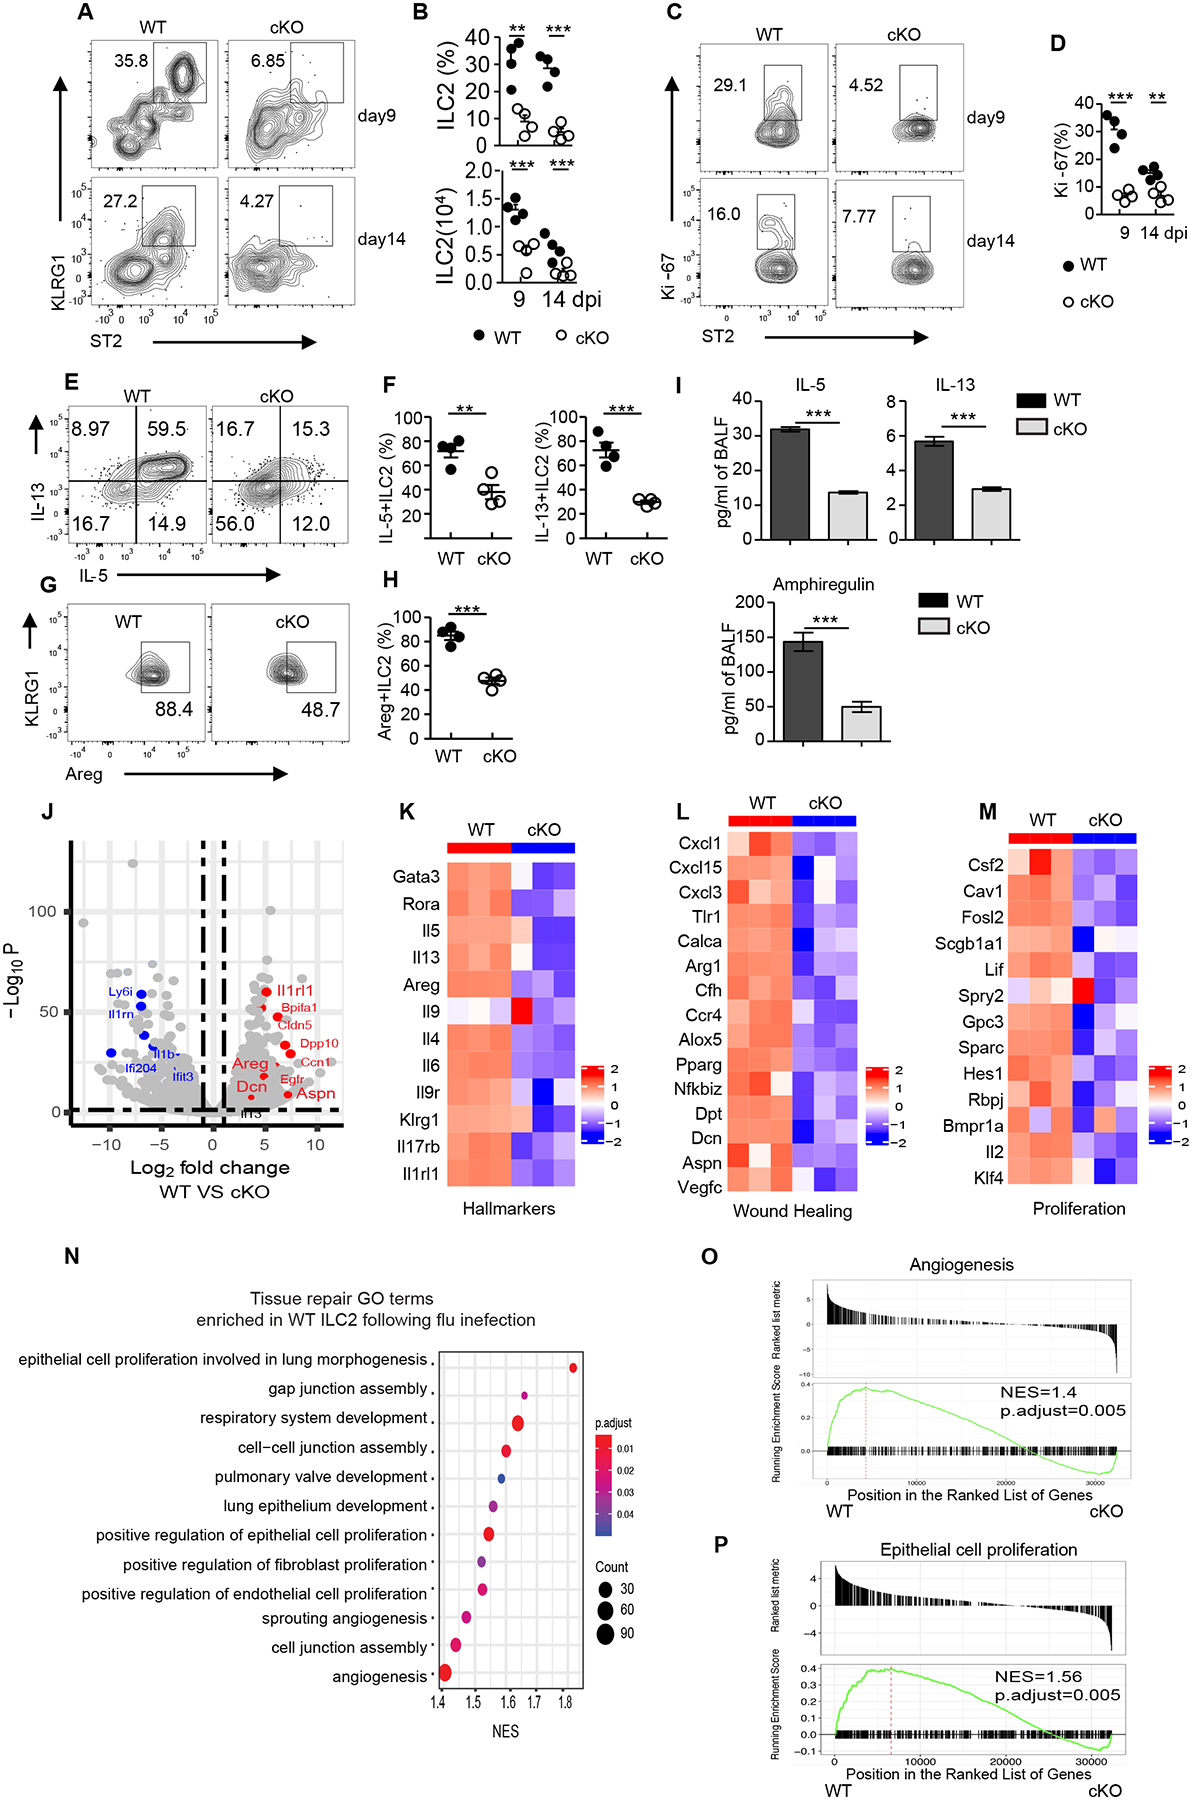
Fig. 3. Impaired lung ILC2 expansion and wound-healing function in virus-infected BATF cKO mice.

(A) Representative flow cytometry plot of ILC2s in the lungs of Batffl/fl (WT) or BATF cKO mice given sublethal PR8 virus infection at the indicated days, data pre-gated on Lin−CD90.2+. (B) Frequency and numbers of lung ILC2s in (A). (C) Representative flow cytometry plot showing Ki-67 expression in lung ILC2s as assessed in (A), numbers represent percentage of Ki-67+ cells in each gate. (D) Frequency of Ki-67+ ILC2s in (C). (E) Representative flow plots of IL-5- and IL-13-expressing ILC2s (pre-gated on Lin−CD90.2+ KLRG1+) isolated from lung after influenza infection at day 9. (F) Frequency of IL-5+ (left) and IL-13+ (right) ILC2s in (E). (G) Amphiregulin expression of lung ILC2s (pre-gated on Lin−CD90.2+ KLRG1+) after stimulation with PMA plus ionomycin ex vivo. (H) Frequency of Areg+ ILC2s in (G). (I) Protein level of IL-5, IL-13 and amphiregulin in BAL from Batffl/fl (WT) (n=6) and cKO (n=6) after influenza virus infection at day 9. Data are combined from two independent experiments. (J) Volcano plot comparing differentially expressed genes from Batffl/fl (WT) versus cKO ILC2s sorted from lungs after influenza infection on day 9 and subjected to bulk RNA sequencing. Red and blue dots represent upregulated and downregulated genes, respectively, in WT mice. (K-M) Heatmaps of ILC2 hallmark genes (K), wound healing genes (L), and proliferation-related genes (M) from Batffl/fl (WT) versus cKO ILC2s. (O) Selective list of tissue repair Gene Ontology pathways enriched in Batffl/fl (WT) ILC2s. The pathways presented in the plot are significantly enriched (Benjamini-Hochberg adjusted p < 0.05), with the size and color of each dot indicating the number of genes in a pathway and the adjusted p-value, respectively. (O and P) GSEA of selected pathways enriched in Batffl/fl (WT) ILC2. (A-H) Data shown as mean ± SEM. * p < 0.05, ** p < 0.01, *** p < 0.001 (two-tailed unpaired t-test). Each dot represents one mouse (n=4 per group). Data are representative of at least two independent experiments.
