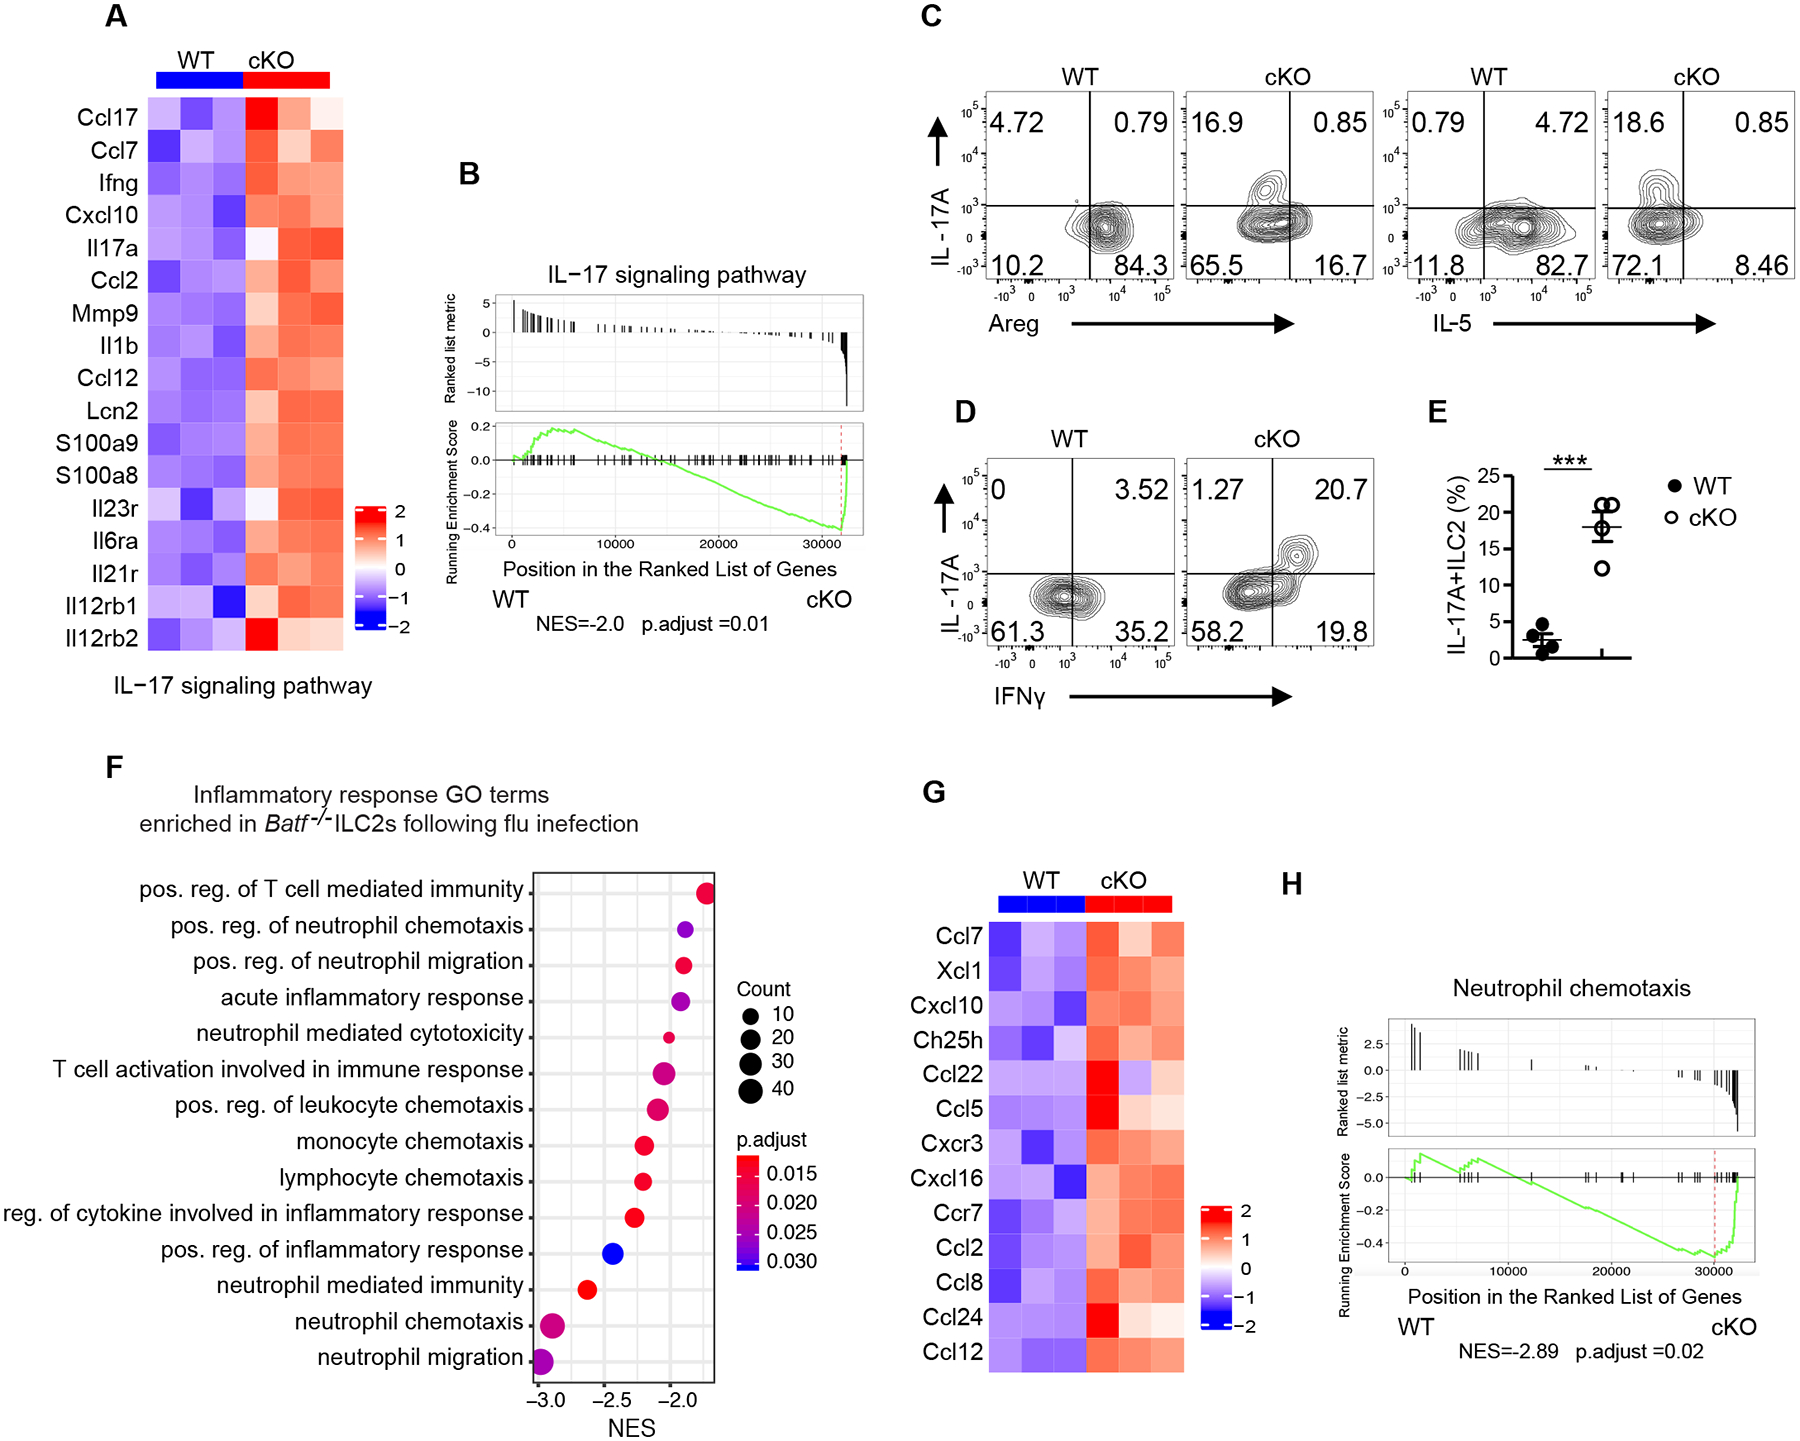
Fig. 4. Batf −/− ILC2s display IL-17A producing inflammatory ILC3-like phenotype after influenza infection.

(A) Heatmap of genes encoding for the IL-17 signaling pathway from WT versus cKO ILC2s sorted from lung after influenza infection at day 9. (B) GSEA plot of the IL-17 pathway, which was enriched in BATF cKO ILC2s. (C-D) Representative flow plot of intracellular staining of IL-17A vs Areg, IL17A vs IL-5 (C), and IL-17A vs IFNγ in ILC2s (pre-gated on Lin−CD90.2+ KLRG1+) (D). (E) Quantification of plots in (D). (F) Selected list of inflammatory response Gene Ontology pathways enriched in cKO ILC2s. The pathways presented in the plot are significantly enriched (Benjamini-Hochberg adjusted p < 0.05), with the size and color of each dot indicating the number of genes in a pathway and the adjusted p-value, respectively. (G) Heatmaps of genes involved in the GO positive regulation of neutrophil migration. (H) GSEA plot of the positive regulation of neutrophil chemotaxis pathway, which was enriched in cKO ILC2s. (C-E) Data shown as mean ± SEM. * p < 0.05, ** p < 0.01, *** p < 0.001 (two-tailed unpaired t-test). Each dot represents one mouse (n=4 per group). Data are representative of at two independent experiments.
