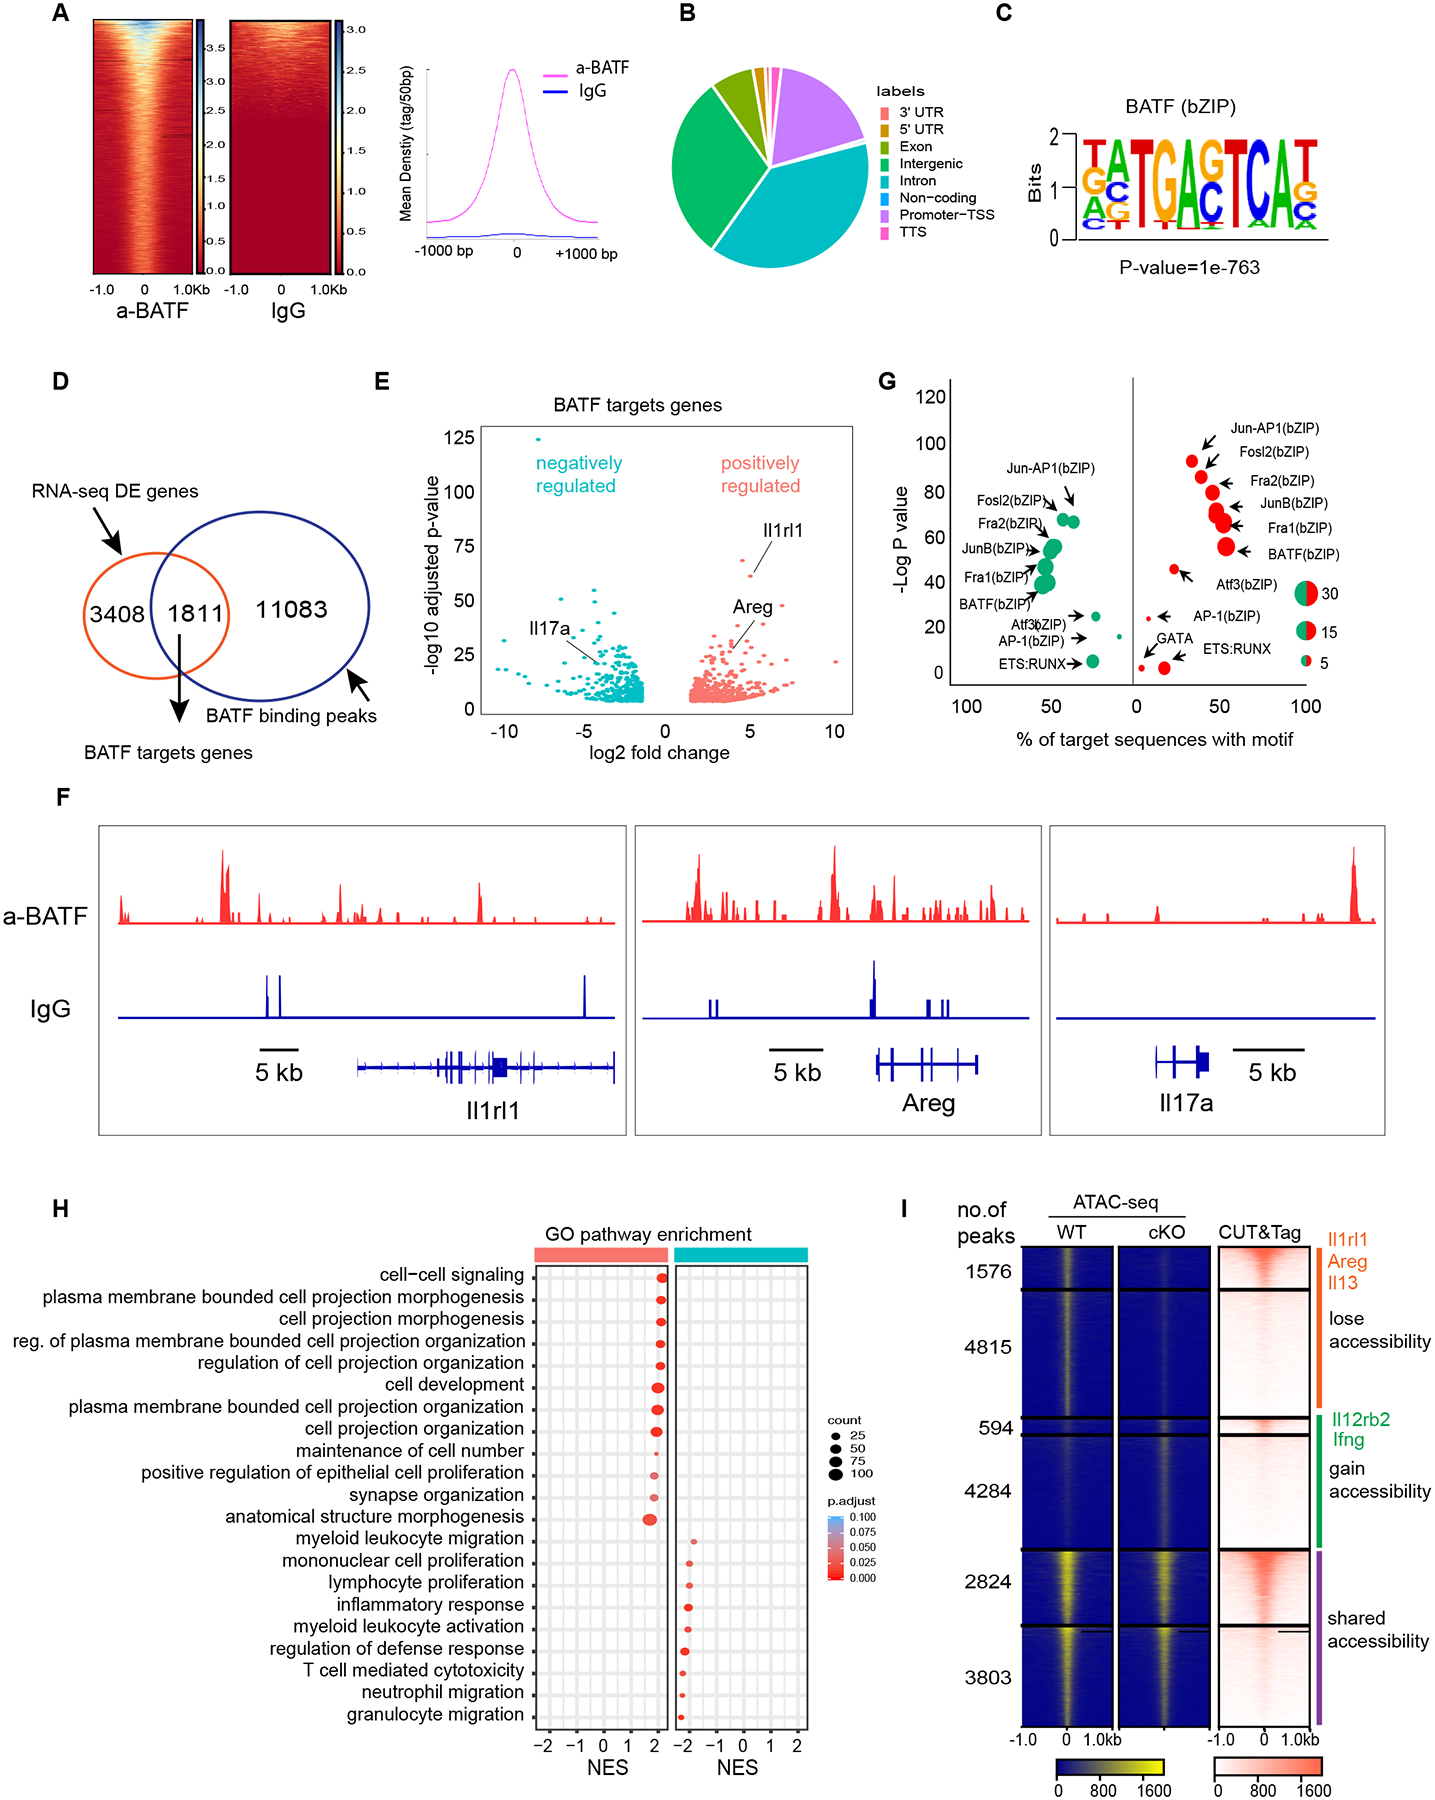
Fig. 6. BATF promotes expression of tissue repair genes and represses inflammatory genes.

(A) Heatmap for genome-wide distribution of anti-BATF and rabbit control IgG binding signals at peak centers in ILC2s sorted from the lung of WT mice using CUT&Tag sequencing. (B) Distribution of BATF binding peaks across the genome of ILC2s. (C) HOMER de novo motif analysis of TF binding motif scores highest in BATF binding regions. (D) Venn diagram of BATF-regulated genes and BATF-bound genes. (E) Volcano plots of expression levels of BATF target genes in WT versus cKO ILC2s sorted from lungs after influenza infection at day 9. Red, increased expression in WT ILC2 cells. Green, reduced expression in WT, the represented genes are highlighted. (F) Representative alignments of CUT&Tag ChIP-seq data of BATF and IgG binding to the indicated loci in ILC2s. (G) List of top HOMER known motifs enriched in BATF binding peaks, size of dot indicate the percentage of no target sequence with motif, color of dot indicate BATF positively (red) or negatively (green) regulated as in (E). (H) Selective list of Gene Ontology pathways enriched in WT and cKO ILC2s based on (E). The pathways presented in the plot are significantly enriched (Benjamini-Hochberg adjusted p < 0.05), with the size and color of each dot indicating the number of genes in a pathway and the adjusted p-value, respectively. (I) Heatmap of all atlas peaks of ATAC-seq of enhancers in WT and cKO ILC2s, including peaks that gain and lose accessibility between WT and cKO ILC2s and those in common between the two (left and middle panels), the right panel shows heatmap of BATF binding peaks according to atlas peaks in the left and middle panels.
