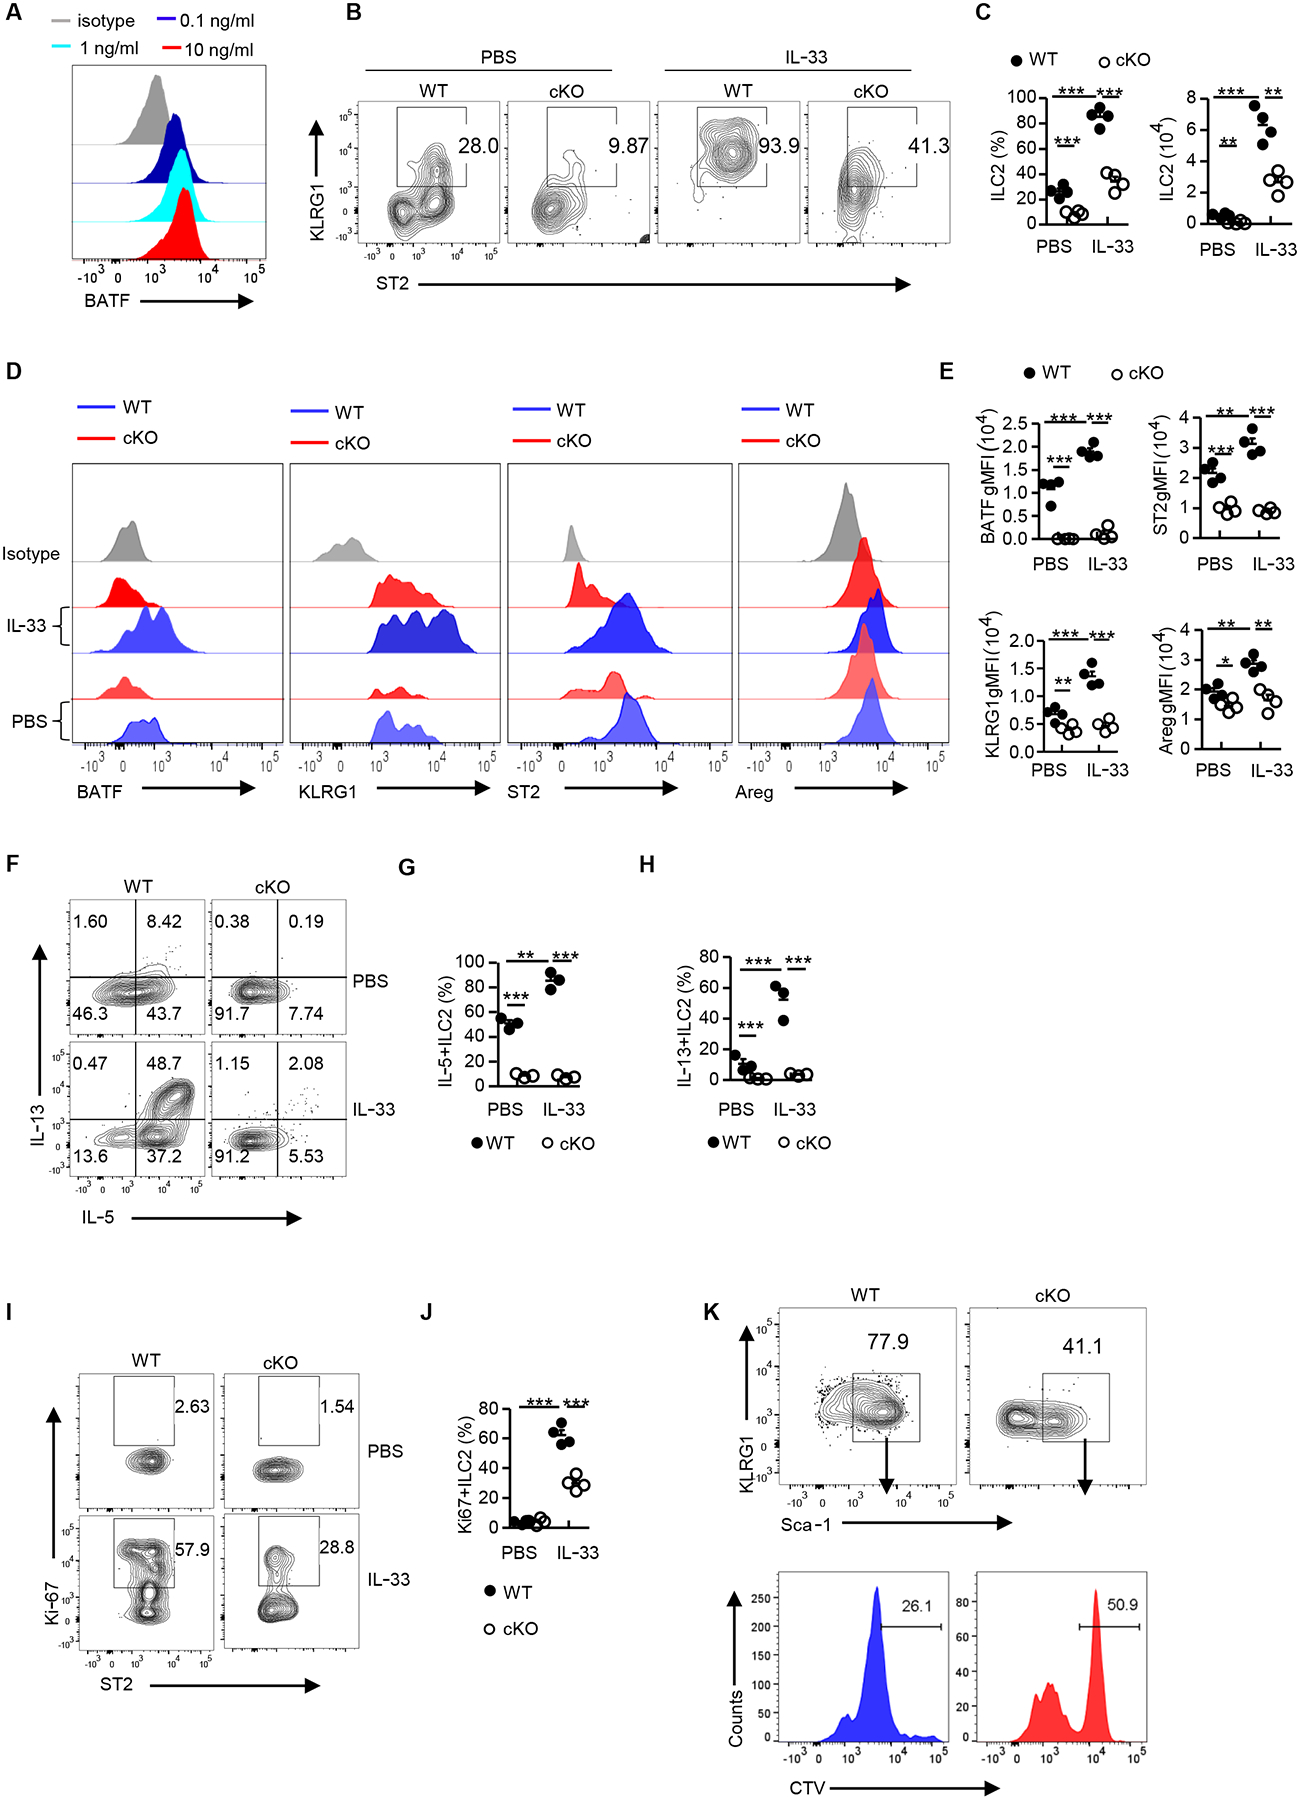
Fig. 7. BATF promotes ILC2 function via the IL-33-BATF-ST2 axis.

(A) Flow cytometry analysis of BATF expression in ILC2s (pre-gated on Lin−CD90.2+ST2+) sorted from Batffl/fl (WT) mouse lungs and cultured in vitro with different doses of IL-33 for 2–3 days. Histograms are representative of two independent experiments. (B) Representative flow plot showing lung ILC2s in Batffl/fl (WT) and cKO treated with PBS or IL-33, pre-gated on Lin−CD90.2+ cells. (C) Frequency and number of lung ILC2s in (C) (n=4 per group). (D) Flow cytometry analysis of BATF, KLRG1, ST2 and Areg expression in ILC2s (pre-gated on Lin−CD90.2+ST2+) as assessed in (B). (E) Quantification of BATF, KLRG1, ST2, and Areg gMFI in (D) (n=4 per group). (F) Flow cytometry analyzing intracellular levels of IL-5 and IL-13 from lung mILC2s (pre-gated on Lin−CD90.2+ KLRG1+) as in (B) but following stimulation with PMA plus ionomycin ex vivo. (G-H) Frequency of IL-5+ (G) or IL-13+ (H) lung ILC2s in (F) (n=4 per group). (I) Flow cytometry analysis of Ki-67 expression in lung ILC2s as in (B). Numbers in flow plots represent the percentage of Ki-67+ cells in each gate. (J) Frequency of Ki-67 positive ILC2s in (I) (n=4 per group). (K) FACS analysis of lung ILC2s sorted from Batffl/fl (WT) and cKO mice as indicated in (A), labeled with CTV, and cultured in vitro for 2–3 days. Data shown as mean ± SEM. * p < 0.05, ** p < 0.01, *** p < 0.001 (two-tailed unpaired t-test). Each dot represents one mouse. Data are representative of at least two independent experiments.
